
GLOBAL STOCK MARKETS
The overarching themes defining the secular framework are deglobalization, innovation, and fiscal dominance. The trend toward reshoring and the development of local supply chains is driving up production costs; while this fuels inflation, it also necessitates massive investment in domestic infrastructure and automation. Disruptive technologies—such as artificial intelligence, robotics, and the energy transition—are key drivers of productivity gains capable of offsetting inflationary pressures over time. High global sovereign debt limits central banks from aggressively raising interest rates, as doing so would make government refinancing unsustainably expensive. This creates an environment that fosters structurally higher inflation and financial sector constraints.
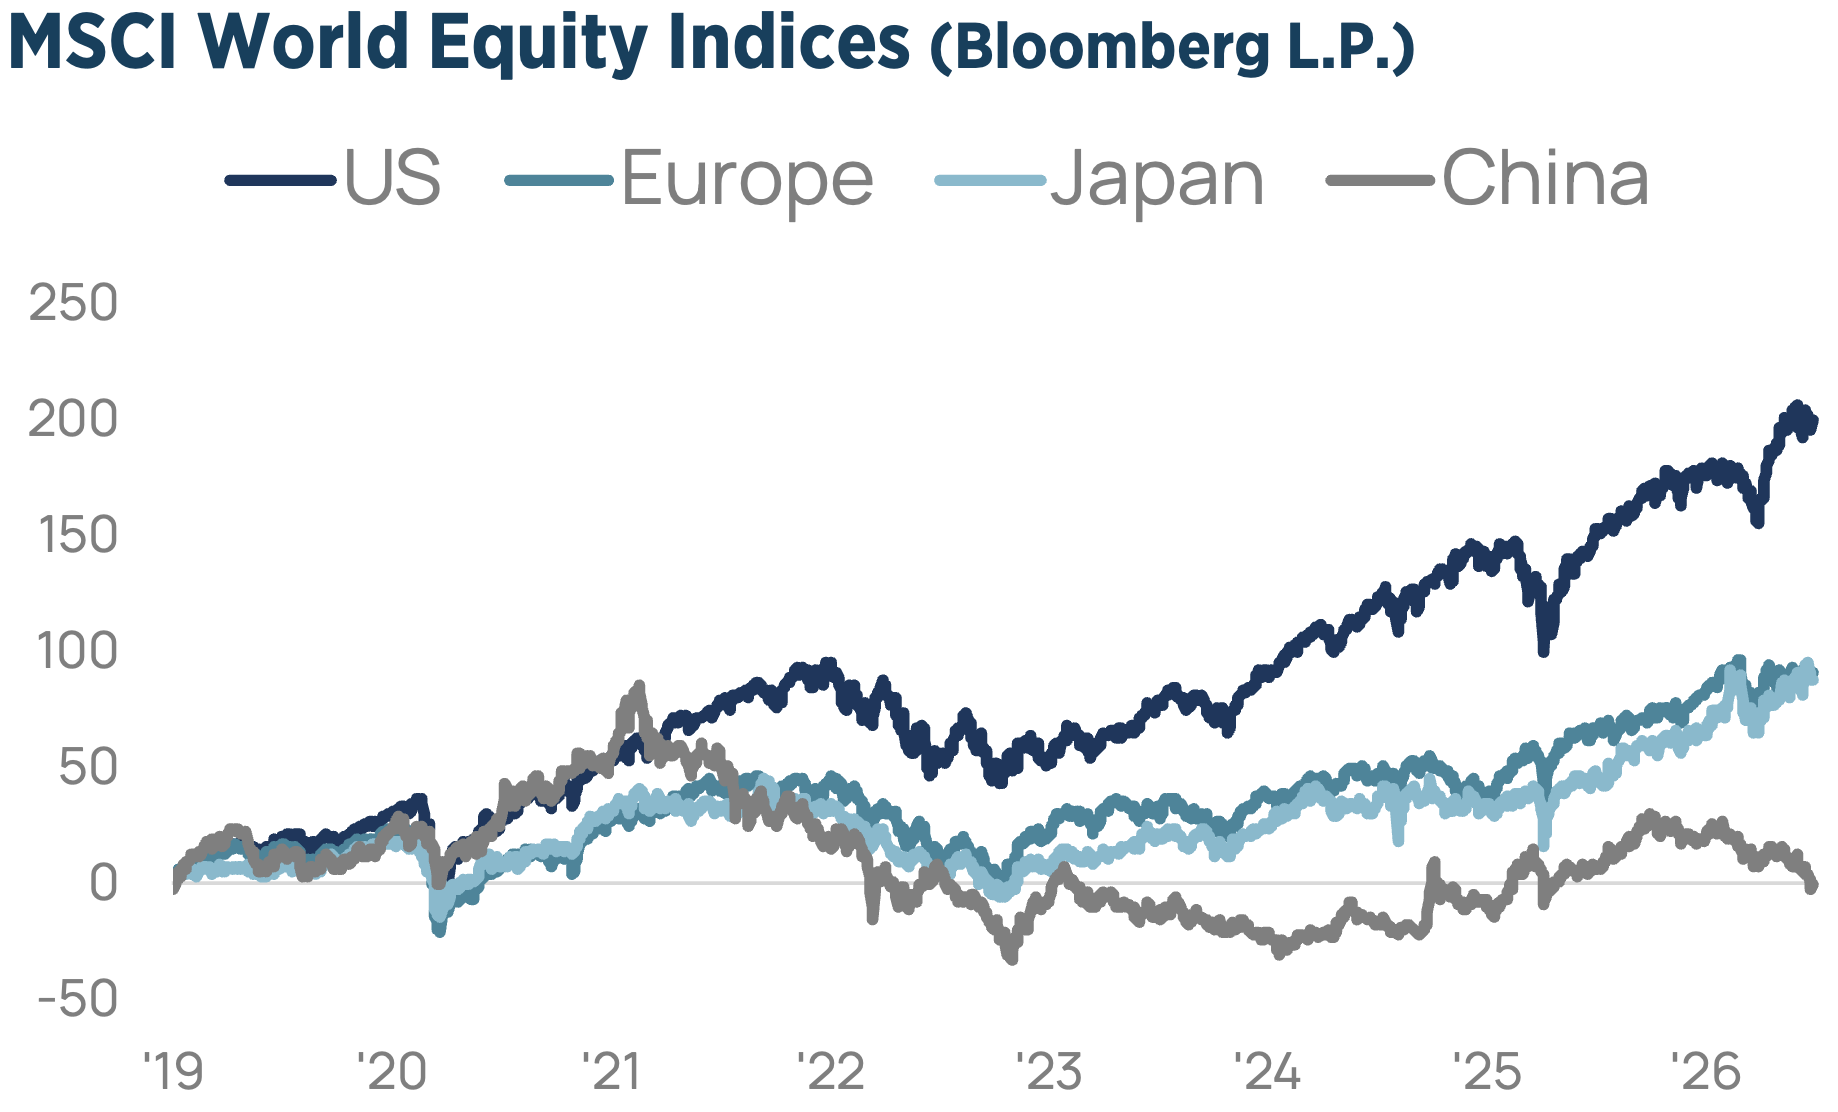 While the defining macro event of 2026 was the outbreak of US-Israeli military operations against Iran, which cascaded across energy markets, inflation, and central bank policy globally. The AI trade has been the key pillar for global equity markets this year. The S&P500 experienced an exceptionally strong second quarter, driven by robust corporate earnings, continued investment in AI infrastructure, resilient economic growth, and a broader expansion in market leadership beyond the mega-cap technology names.
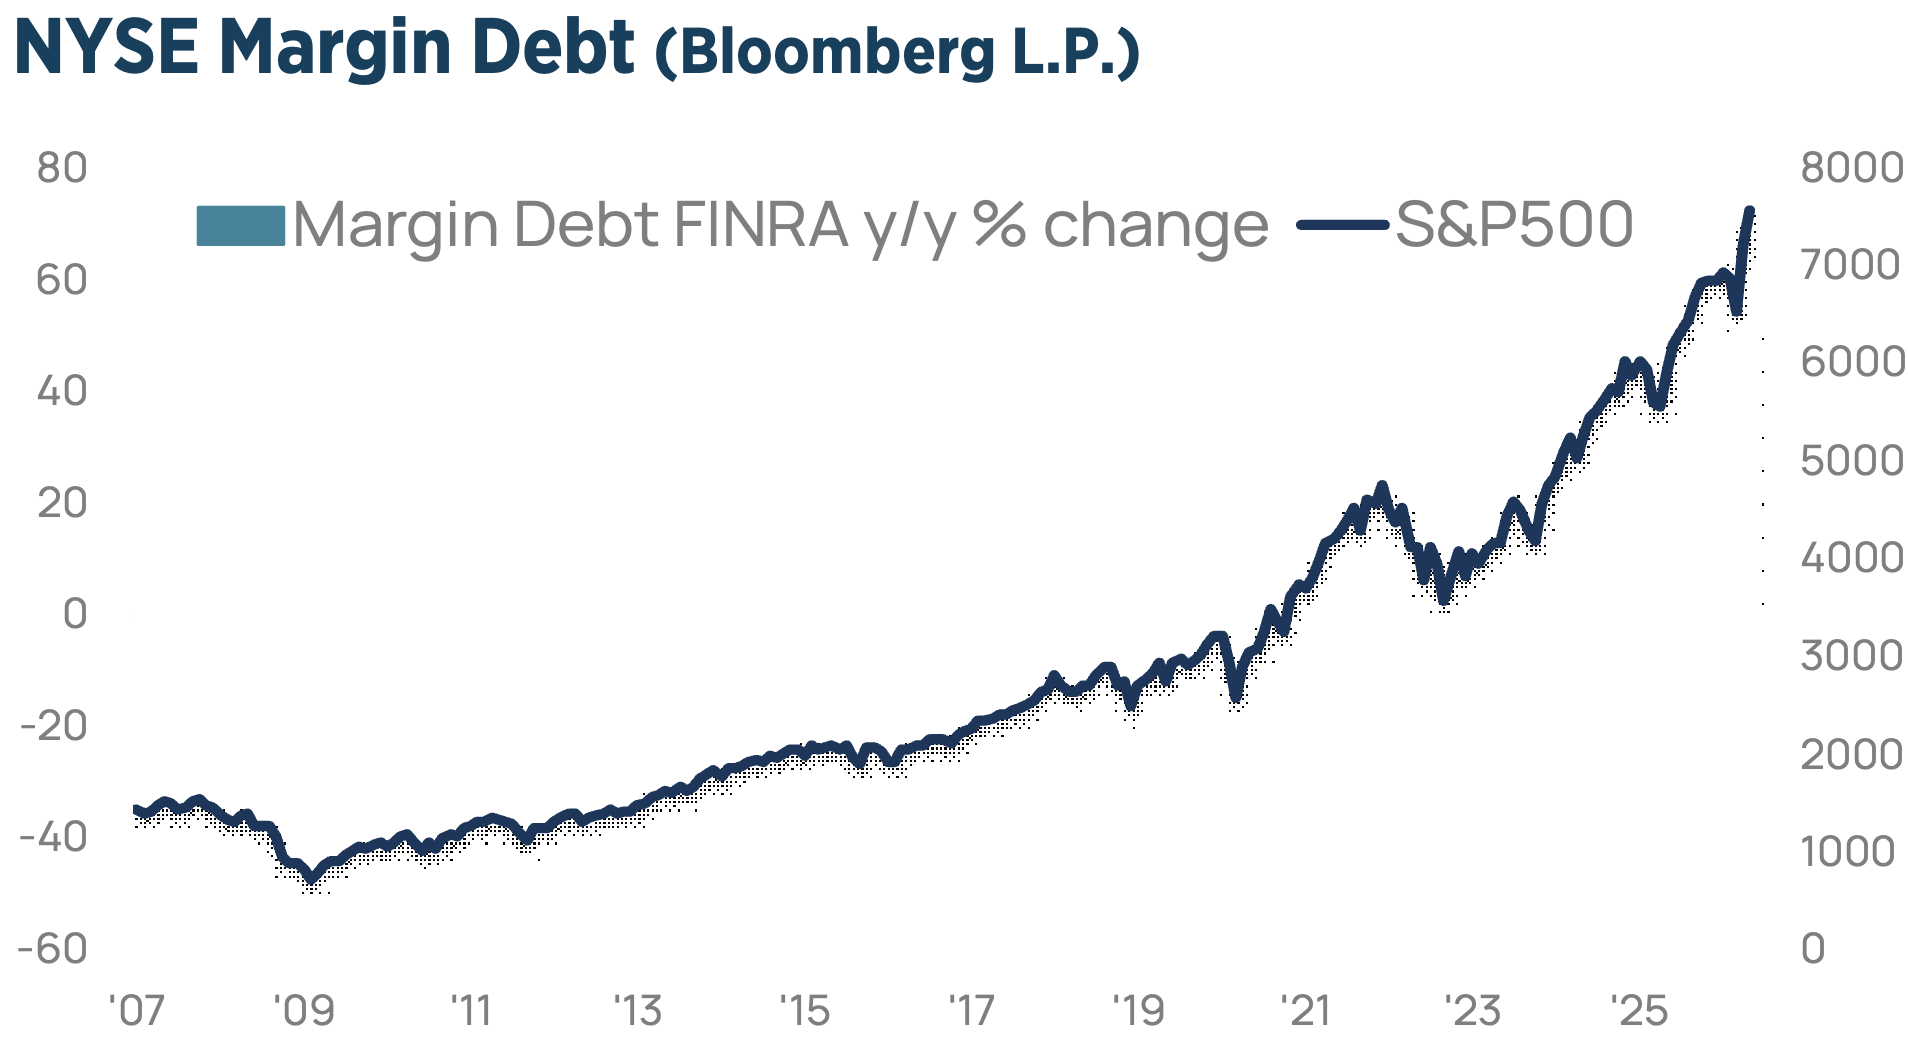 Despite record equity prices, today’s market does not resemble previous valuation-driven bubbles. Current multiples remain broadly consistent with historical ranges, with the advance supported primarily by exceptional growth in corporate earnings and increasingly optimistic profit expectations. The S&P 500 delivered solid earnings growth of 14.1% in 2025. The 2026 consensus estimate of 33% is notably elevated. If there is a bubble today, it is an earnings bubble rather than a valuation bubble. The key risk is therefore not excessive multiples, but whether corporate America can continue to deliver the exceptional profit growth that investors have come to expect.
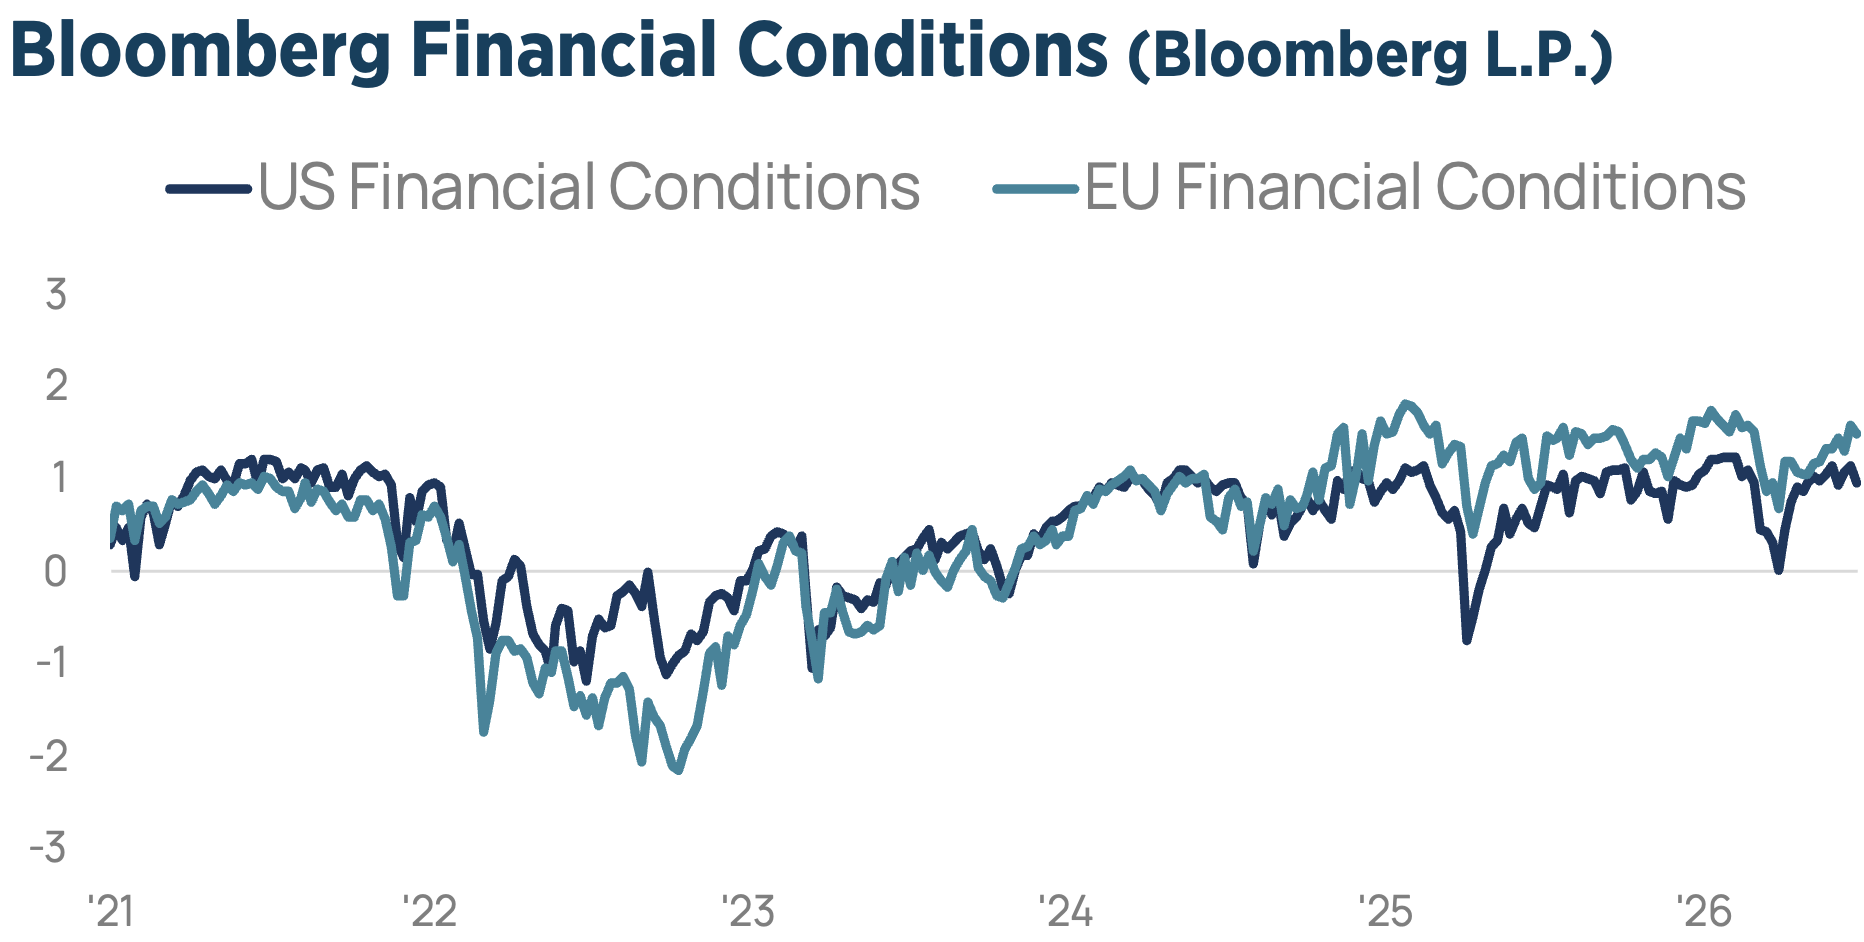 Markets have entered the second half of the year with geopolitical tensions easing but uncertainty remaining elevated. While the ceasefire between Washington and Tehran remains fragile, it has restored confidence to energy markets. Shipping through the Strait of Hormuz has resumed, and oil prices have retraced much of their geopolitical premium, with WTI crude falling more than 30% from its May peak.
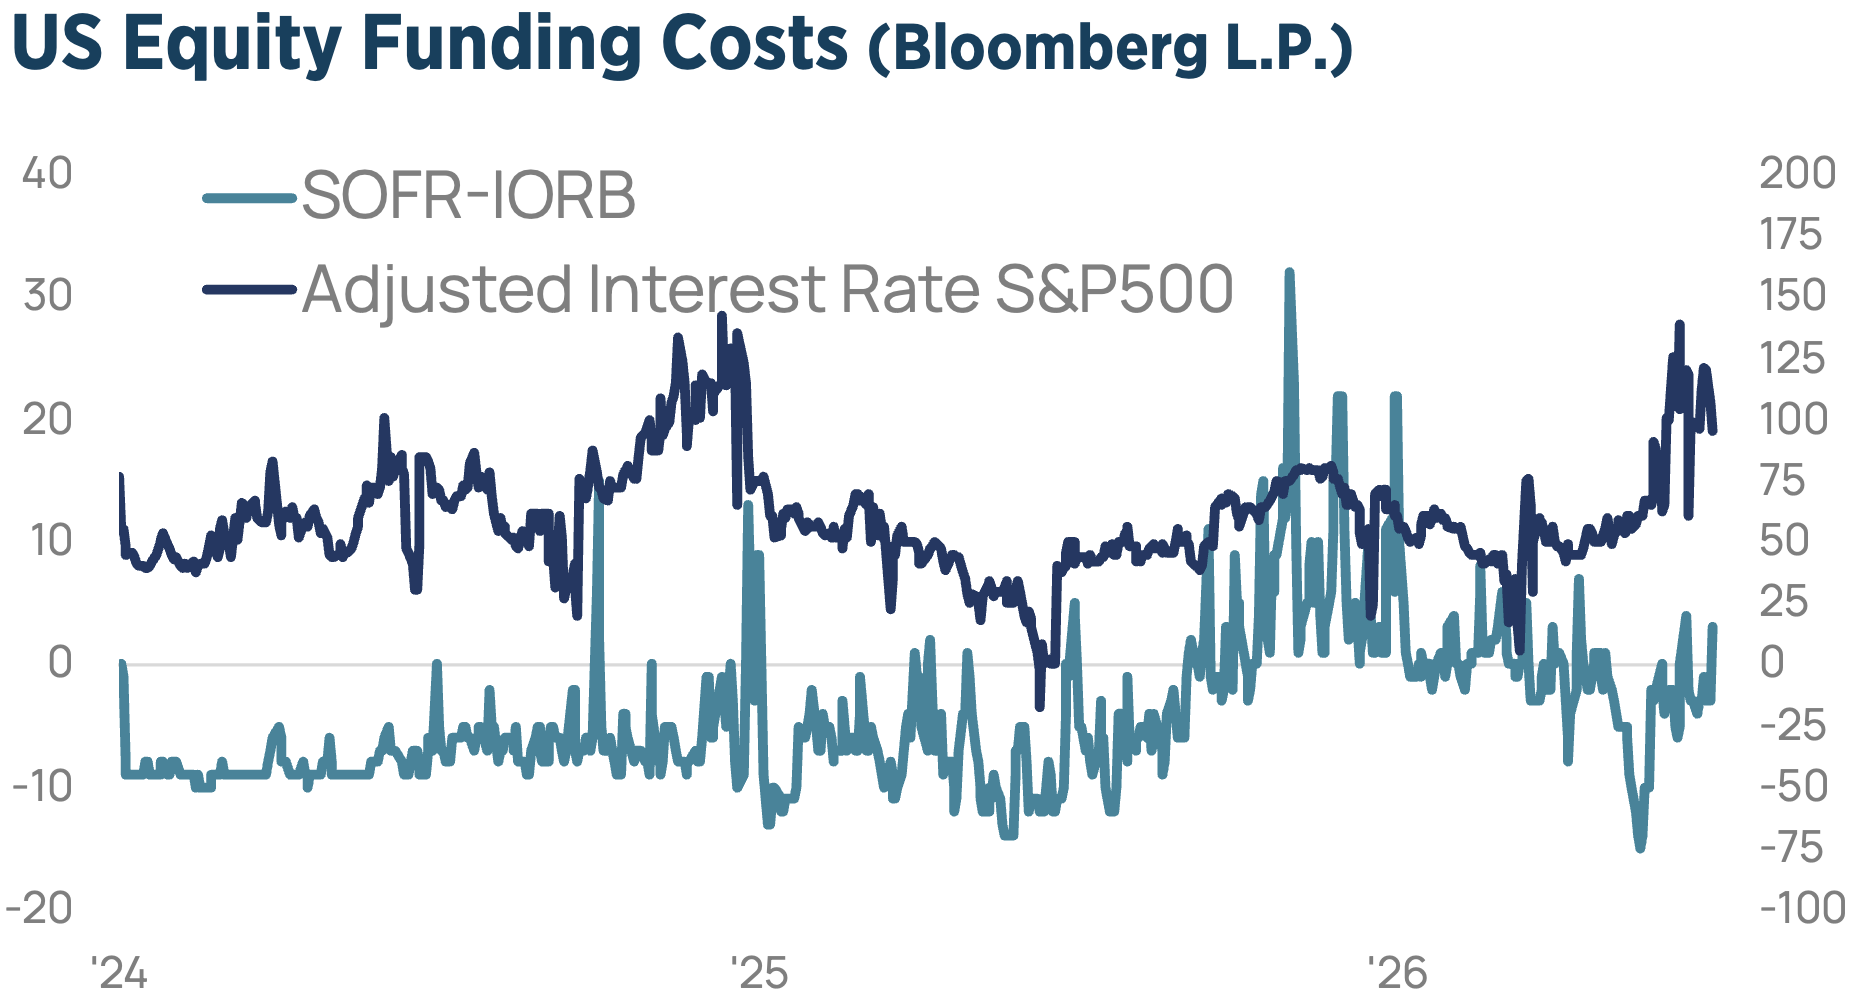 Beneath these fundamentals, however, market liquidity has become more fragile. Funding costs in US equity markets have risen, reflecting increased leverage through ETFs and futures, growing prime brokerage balances, and greater demands on bank balance sheets. While the macroeconomic backdrop remains constructive, this tighter market structure increases the risk that relatively modest market moves become amplified through forced positioning and reduced liquidity.
GLOBAL FIXED INCOME MARKETS
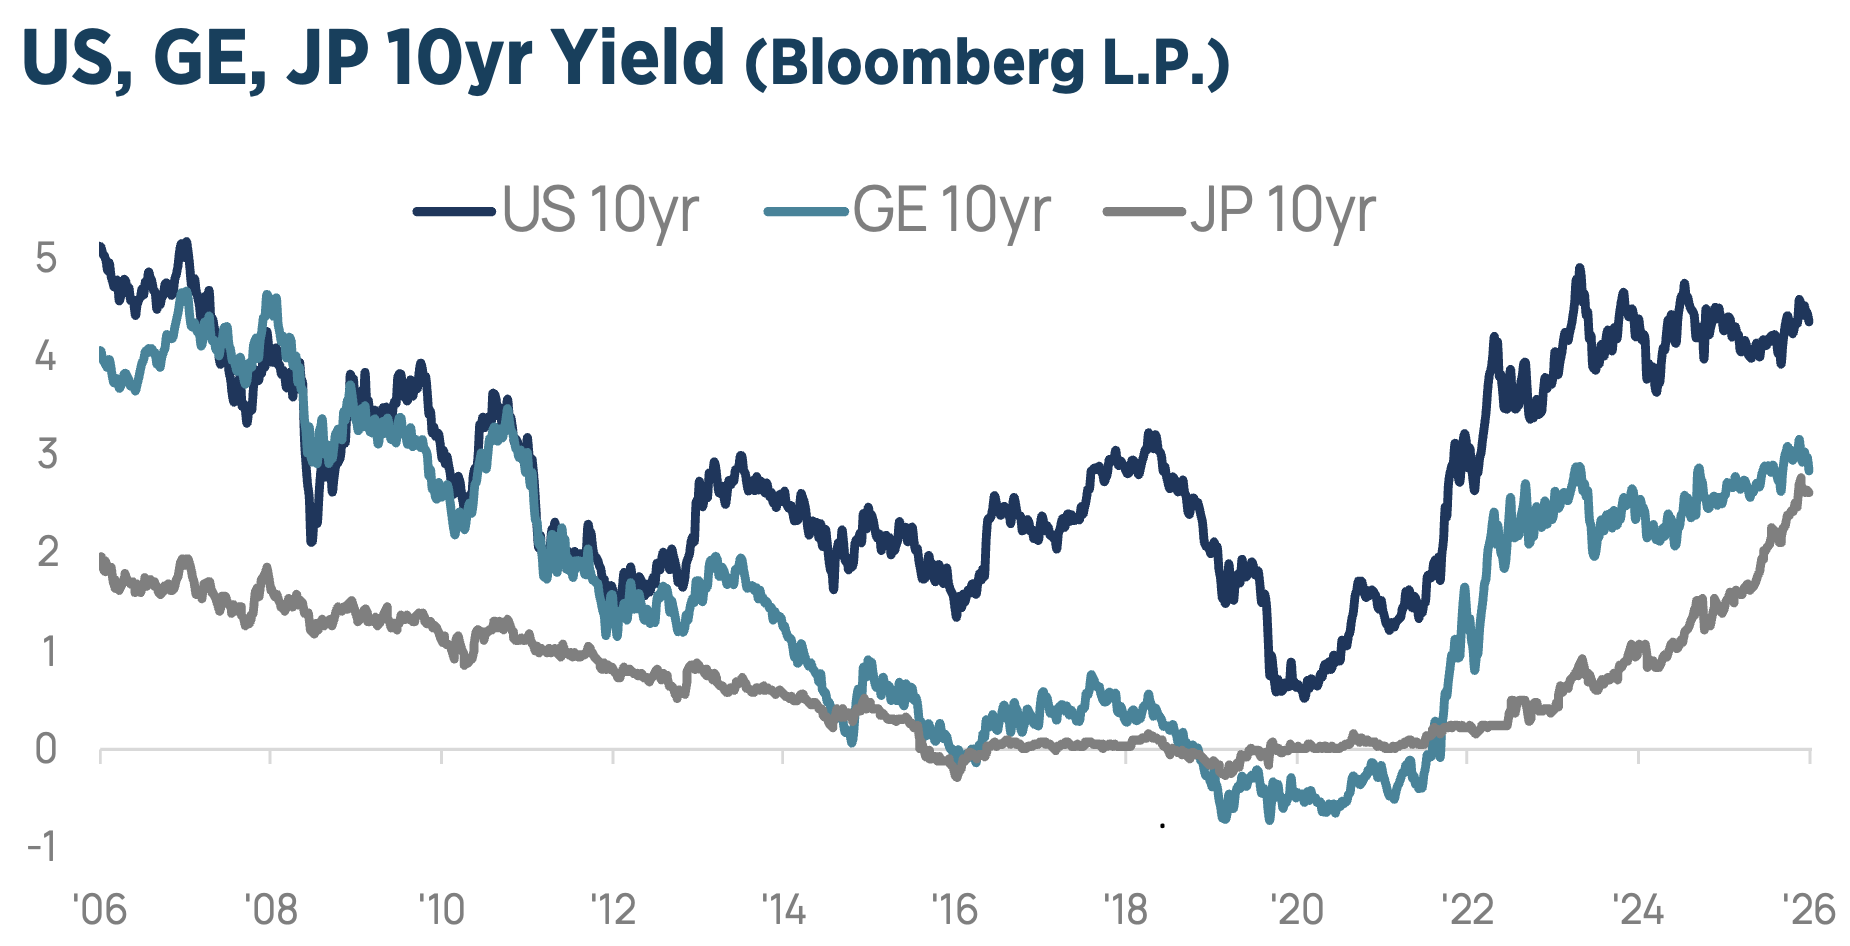
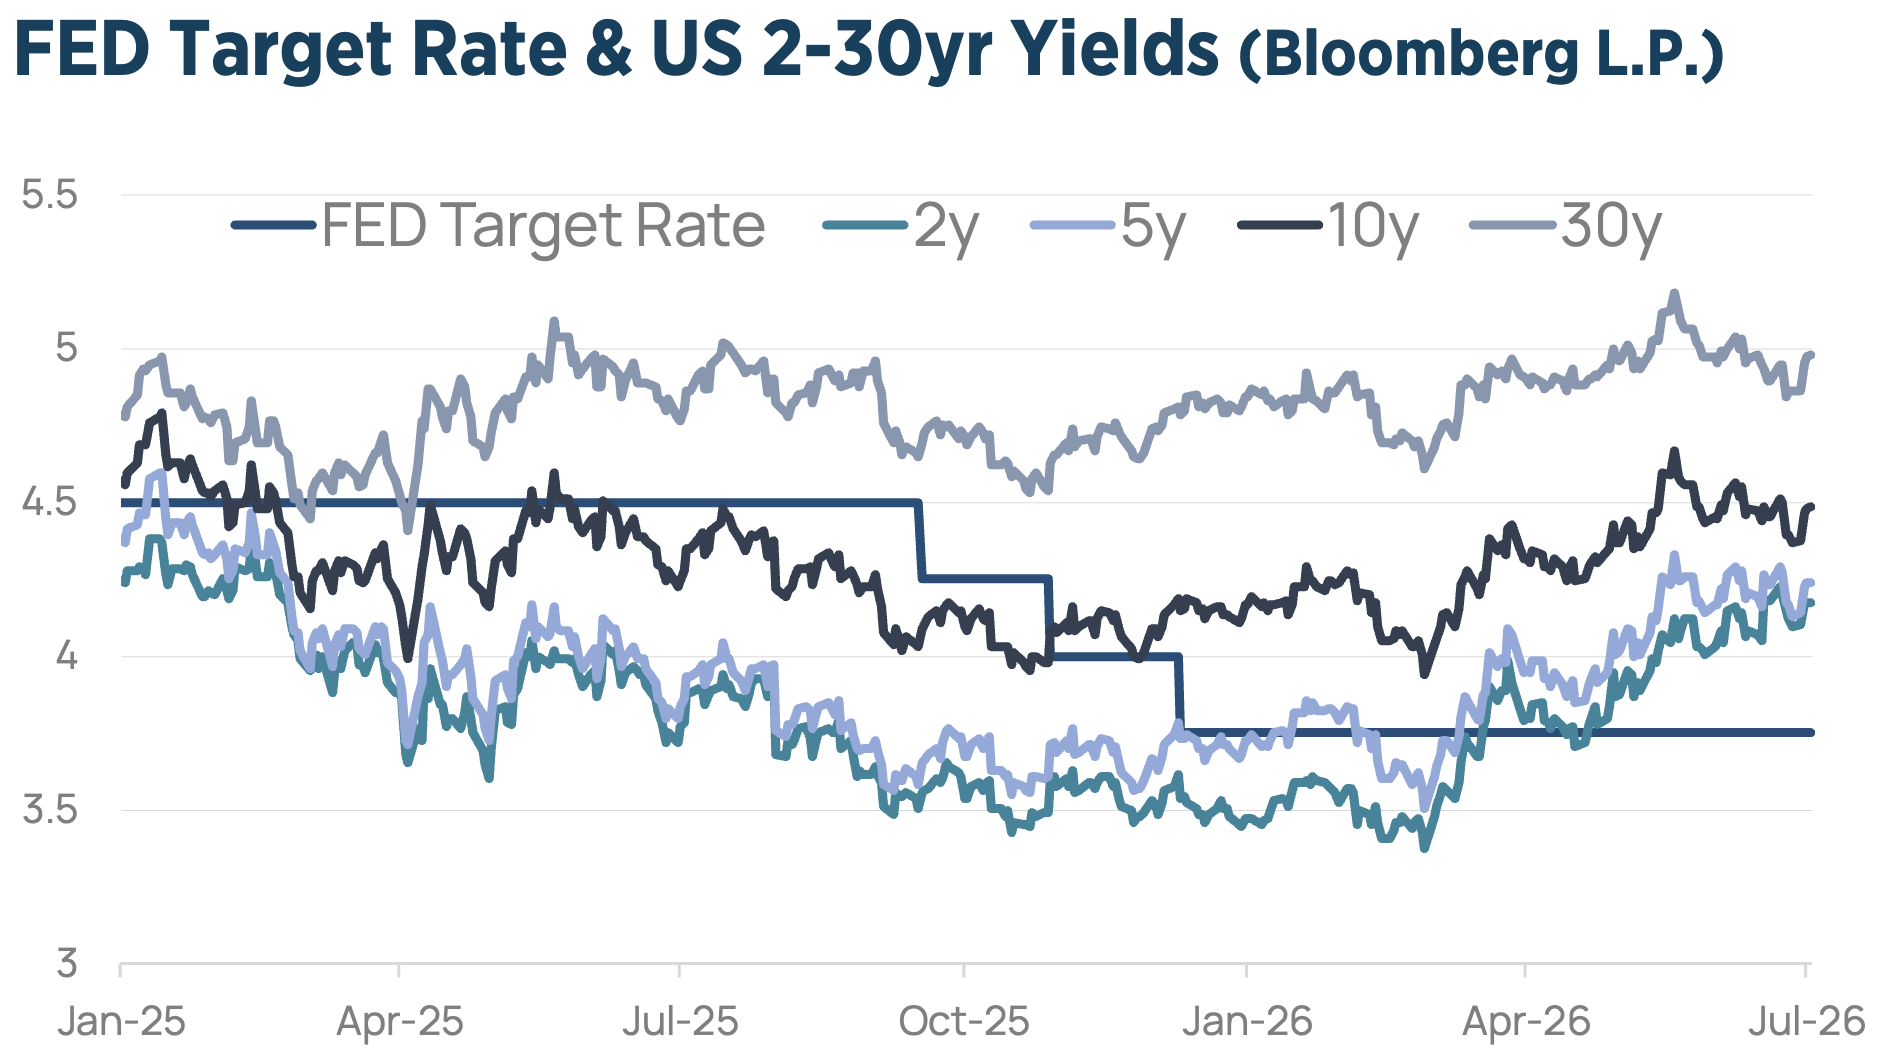
Following a volatile first quarter, in which the Iran conflict triggered a sharp repricing across global markets, fixed income markets stabilized during the second quarter, although underlying conditions remained far from benign. Treasury yields moved higher across the curve, led by the front end as policy expectations repriced, resulting in a flatter yield curve. The 10-year US yield ended the quarter at 4.46%, up from 4.31% at the end of March. Despite the rise in sovereign yields, credit spreads remained near historical tights.
 The FED left the federal funds rate unchanged at 3.50%–3.75% for a fourth consecutive meeting. While the policy decision itself was widely expected, the updated policy outlook proved more hawkish, with half of FOMC participants anticipating at least one rate hike in 2026. Markets responded accordingly: the US Dollar strengthened, Treasury yields moved higher, and equities declined as investors repriced the expected path of monetary policy.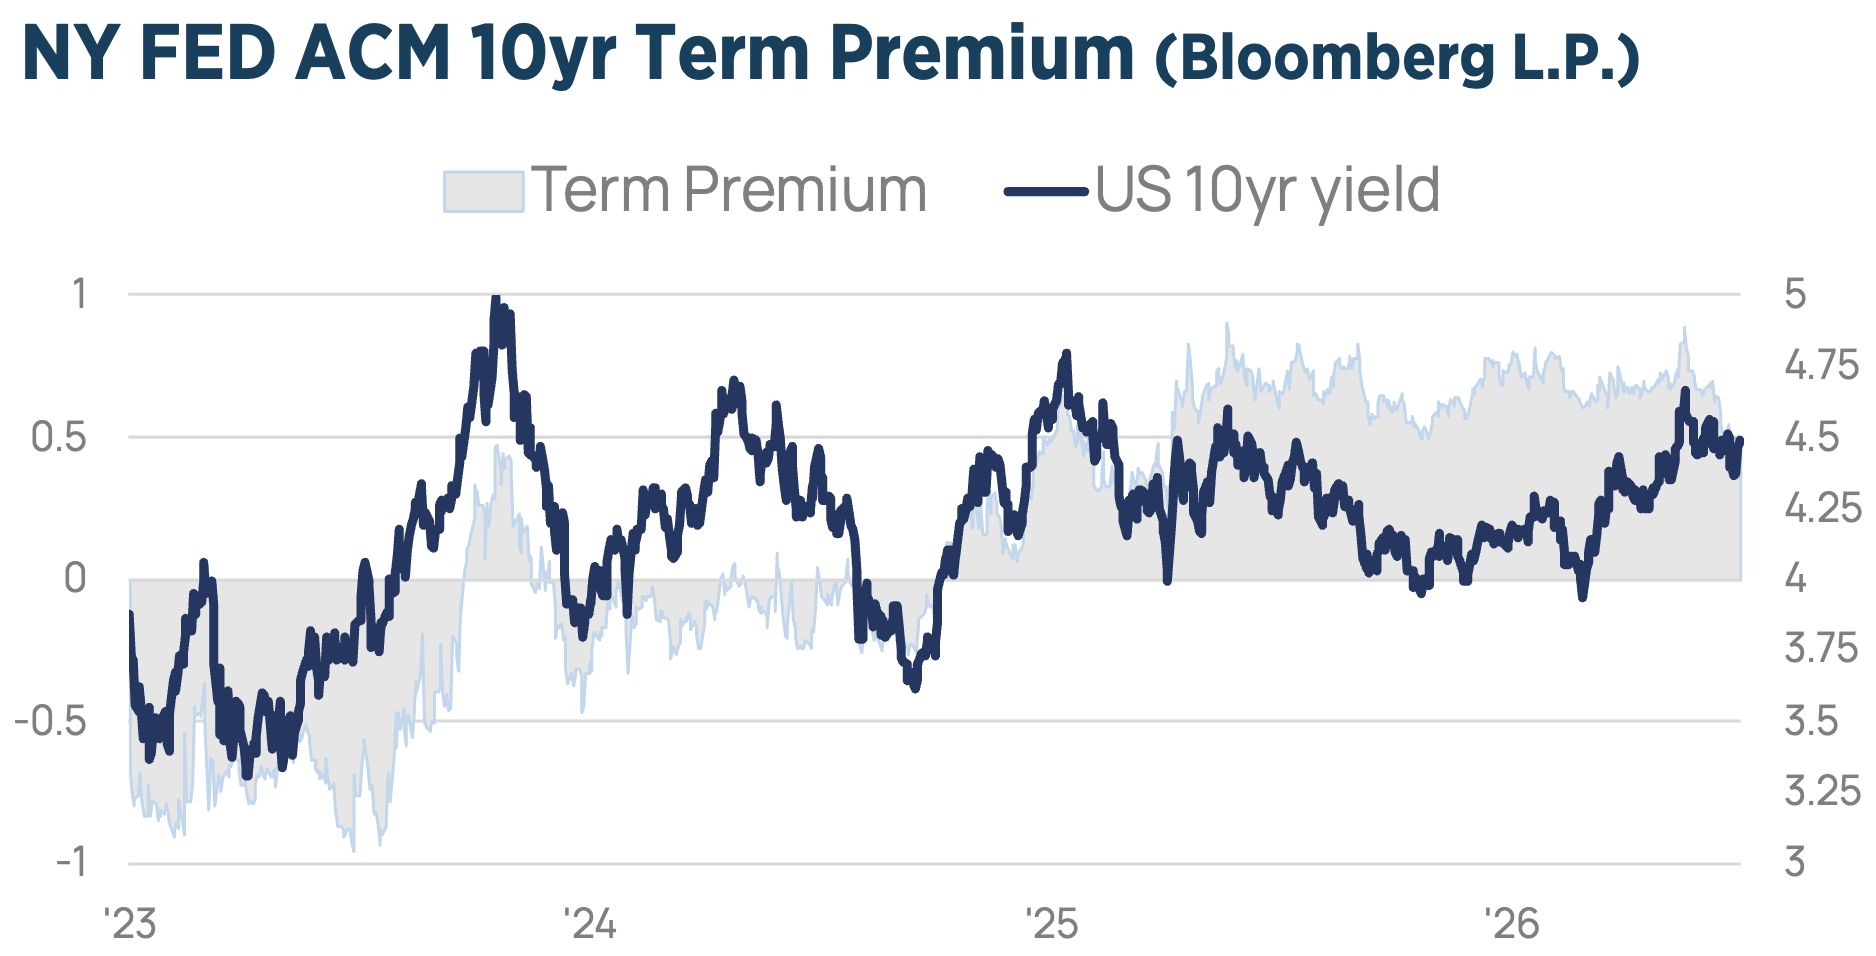
More significant than the policy decision was the debut of Chair Kevin Warsh’s communication framework. Departing from established practice, Warsh didn’t submit an individual rate projection, given his discomfort with projections. He announced a broad review of the FED’s operating framework, spanning communications, balance sheet management, data and analytics, labor market measurement, and the inflation framework. However, he reaffirmed the FED’s unwavering commitment to its 2% inflation objective, emphasizing that restoring and maintaining price stability remains the primary mandate.
 The press conference was considerably shorter, contained virtually no forward guidance, and repeatedly emphasized that policy decisions would remain strictly data dependent. This reflects a deliberate effort to reduce the market’s reliance on central bank signaling and to increase uncertainty around the FED’s near-term reaction function.
The implications are significant. A less predictable and less communicative FED is likely to increase policy uncertainty and contribute to higher risk premia across asset classes. Warsh’s reform-oriented approach may also prove influential beyond the US, potentially encouraging other major central banks to reassess their own communication strategies and place greater emphasis on policy credibility and inflation control.
US DOLLAR
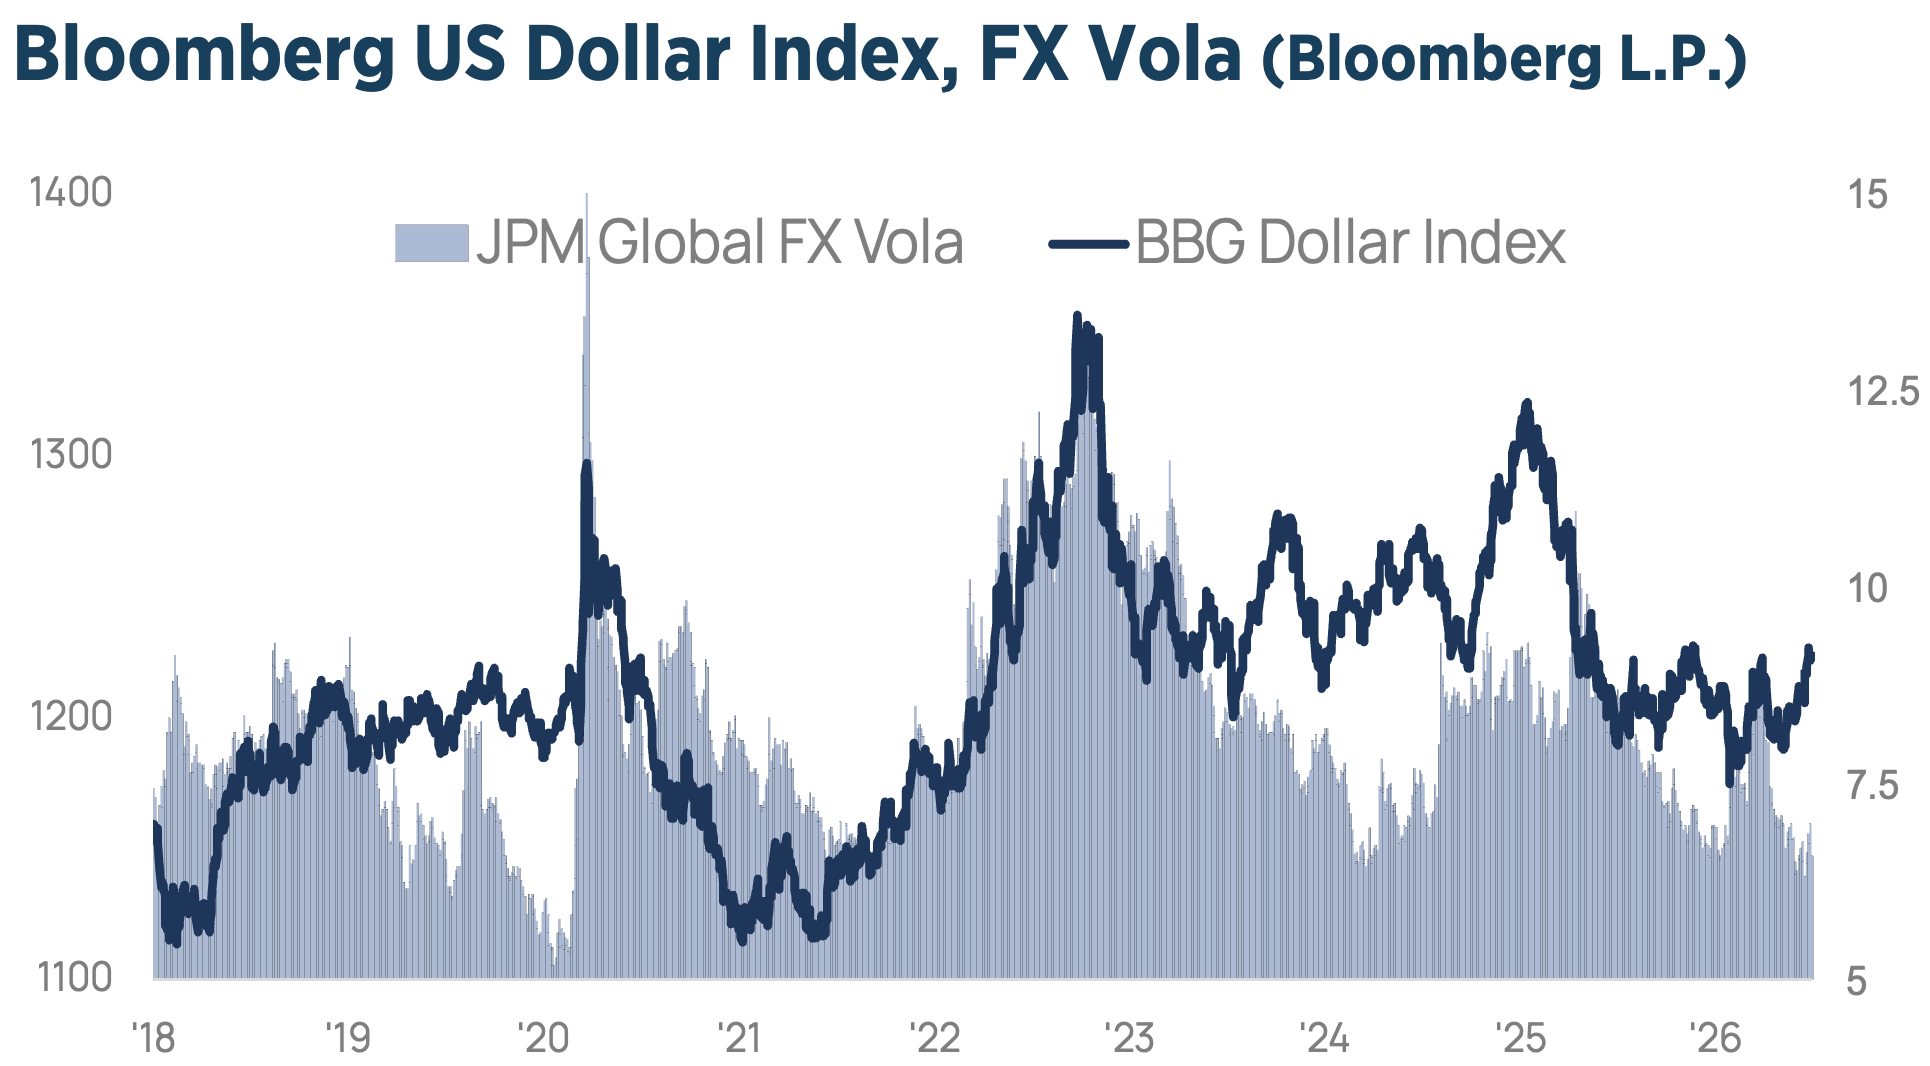
Global FX markets entered the second half of the year with a markedly different set of drivers. As optimism surrounding a resolution to the Iran conflict reduced geopolitical risk and pushed oil prices lower, investors shifted their focus back to economic fundamentals and interest rate differentials. At the same time, continued US economic resilience, persistent inflation, and a more hawkish FED under Chair Kevin Warsh have reinforced the US yield advantage, creating the conditions for a broader Dollar recovery, at least through the third quarter.
 In the long run, the global financial system will be significantly shaped by the ongoing shift towards a multipolar global monetary system, with the US and China utilizing different strategies to gain influence. The US is increasingly relying on financial technology. The US’ approach focuses on the development of Dollar-pegged stablecoins. China is working on the internationalization of the Yuan and the gradual reduction of its dependence on the Dollar through a dual strategy of Gold accumulation and the promotion its own digital currency. As we noted at the beginning of the year, 2026 continues to be a very interesting period for the FX markets, indeed.
COMMODITIES
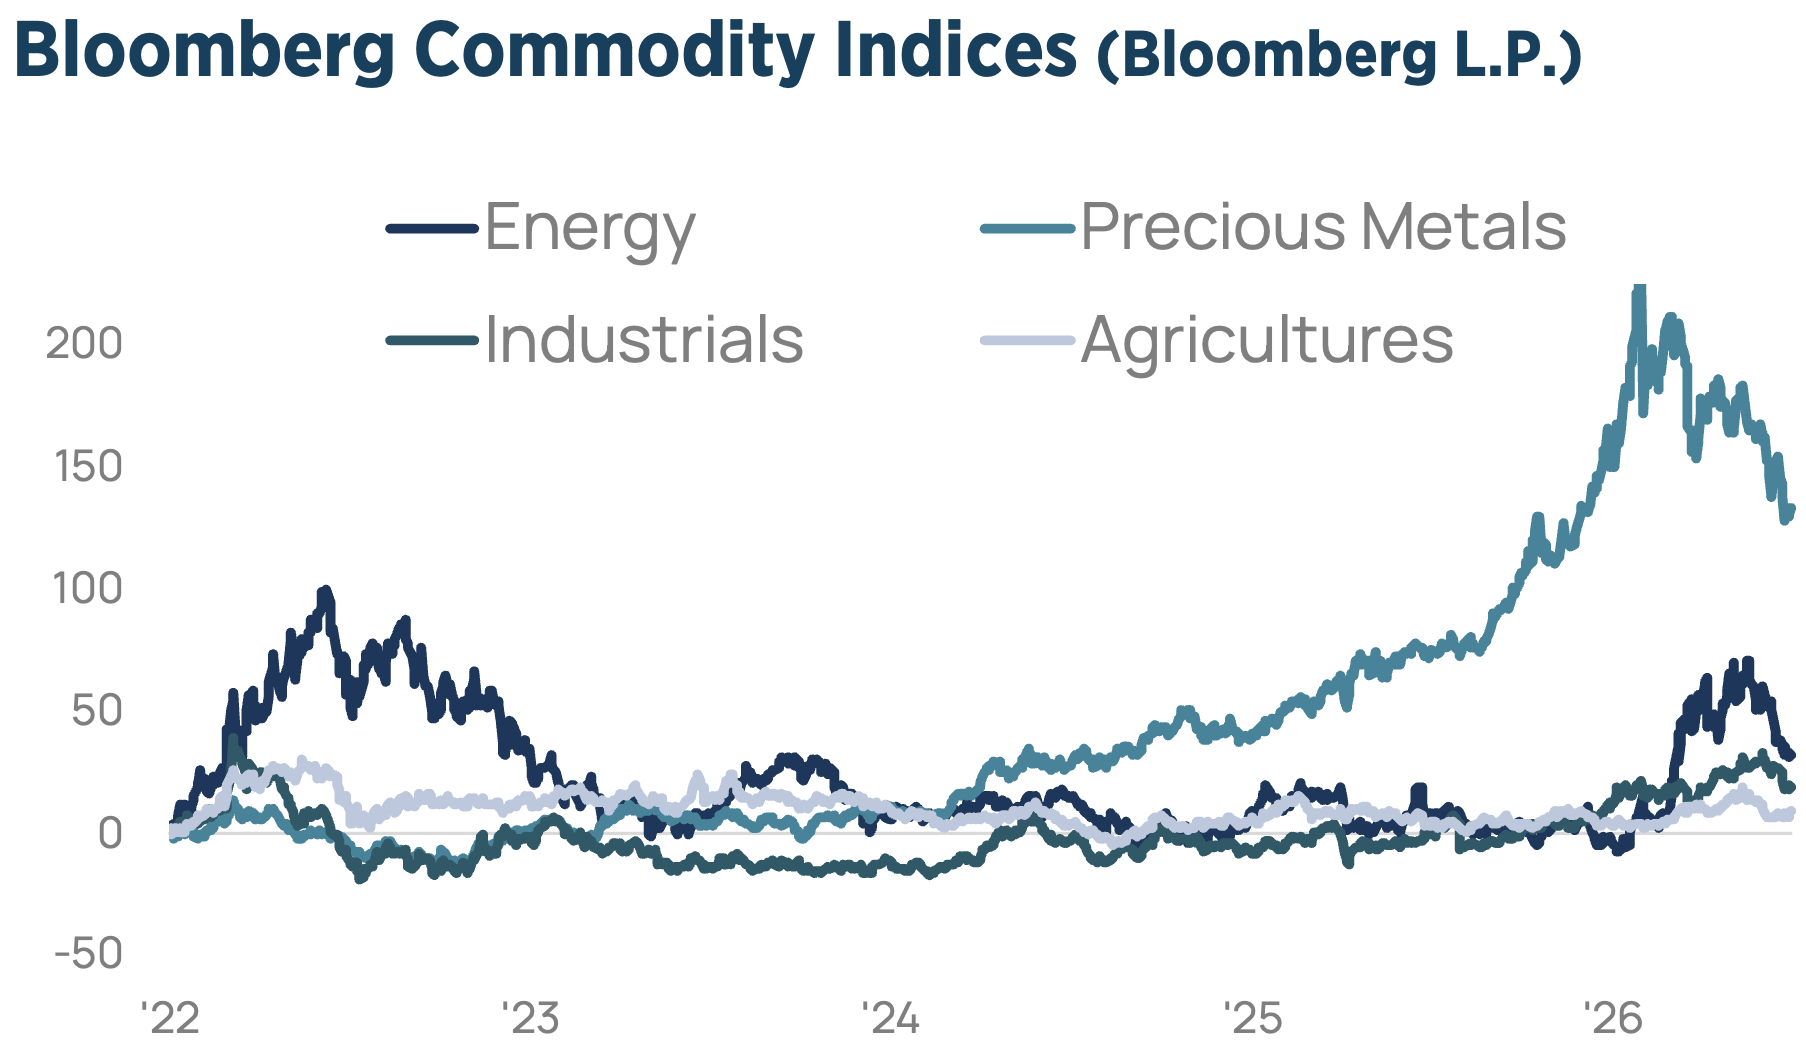
The Bloomberg Commodity Index was down 8% in the second quarter, after gaining 24% in the first quarter. The precious Metals index led by falling -15%, the Energy Index fell -8%, yet, is still +40% since the start of the year. Industrial Metals and Agricultures remained flat.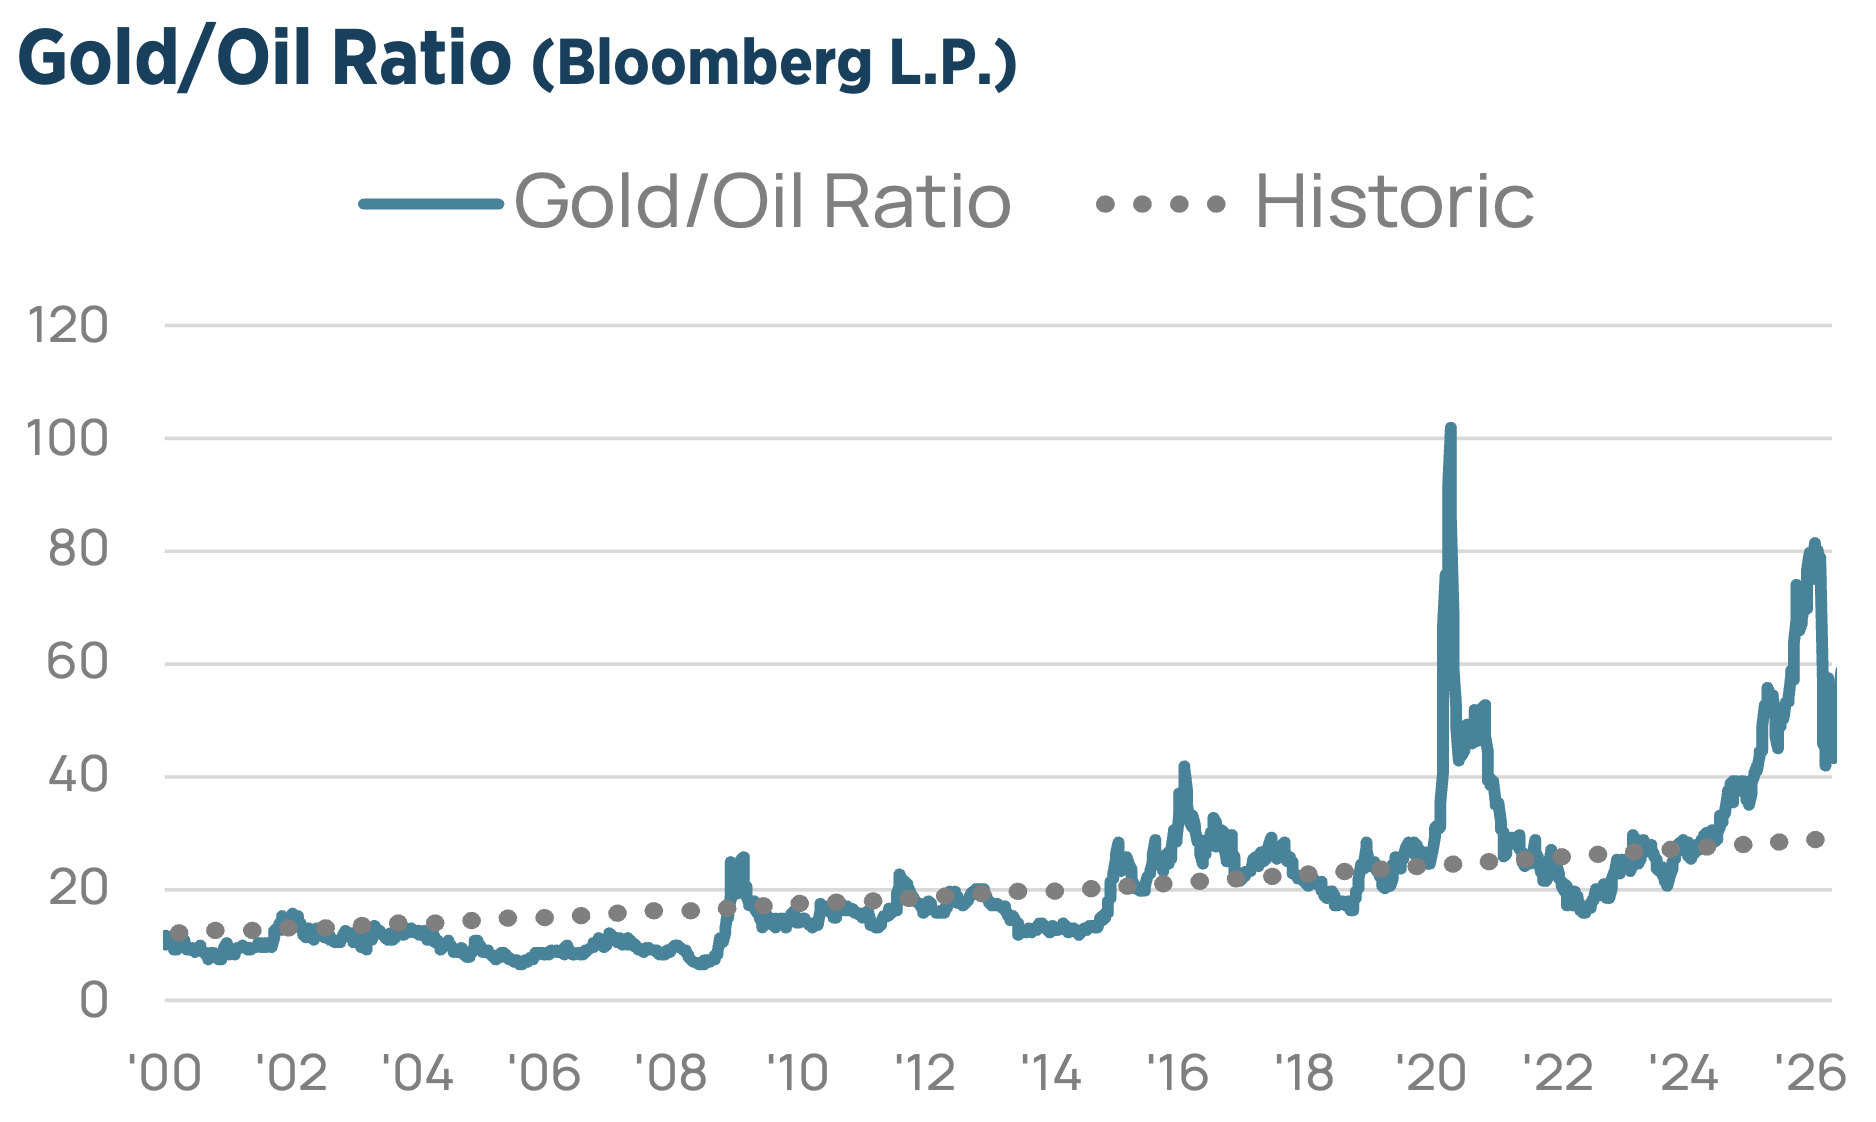
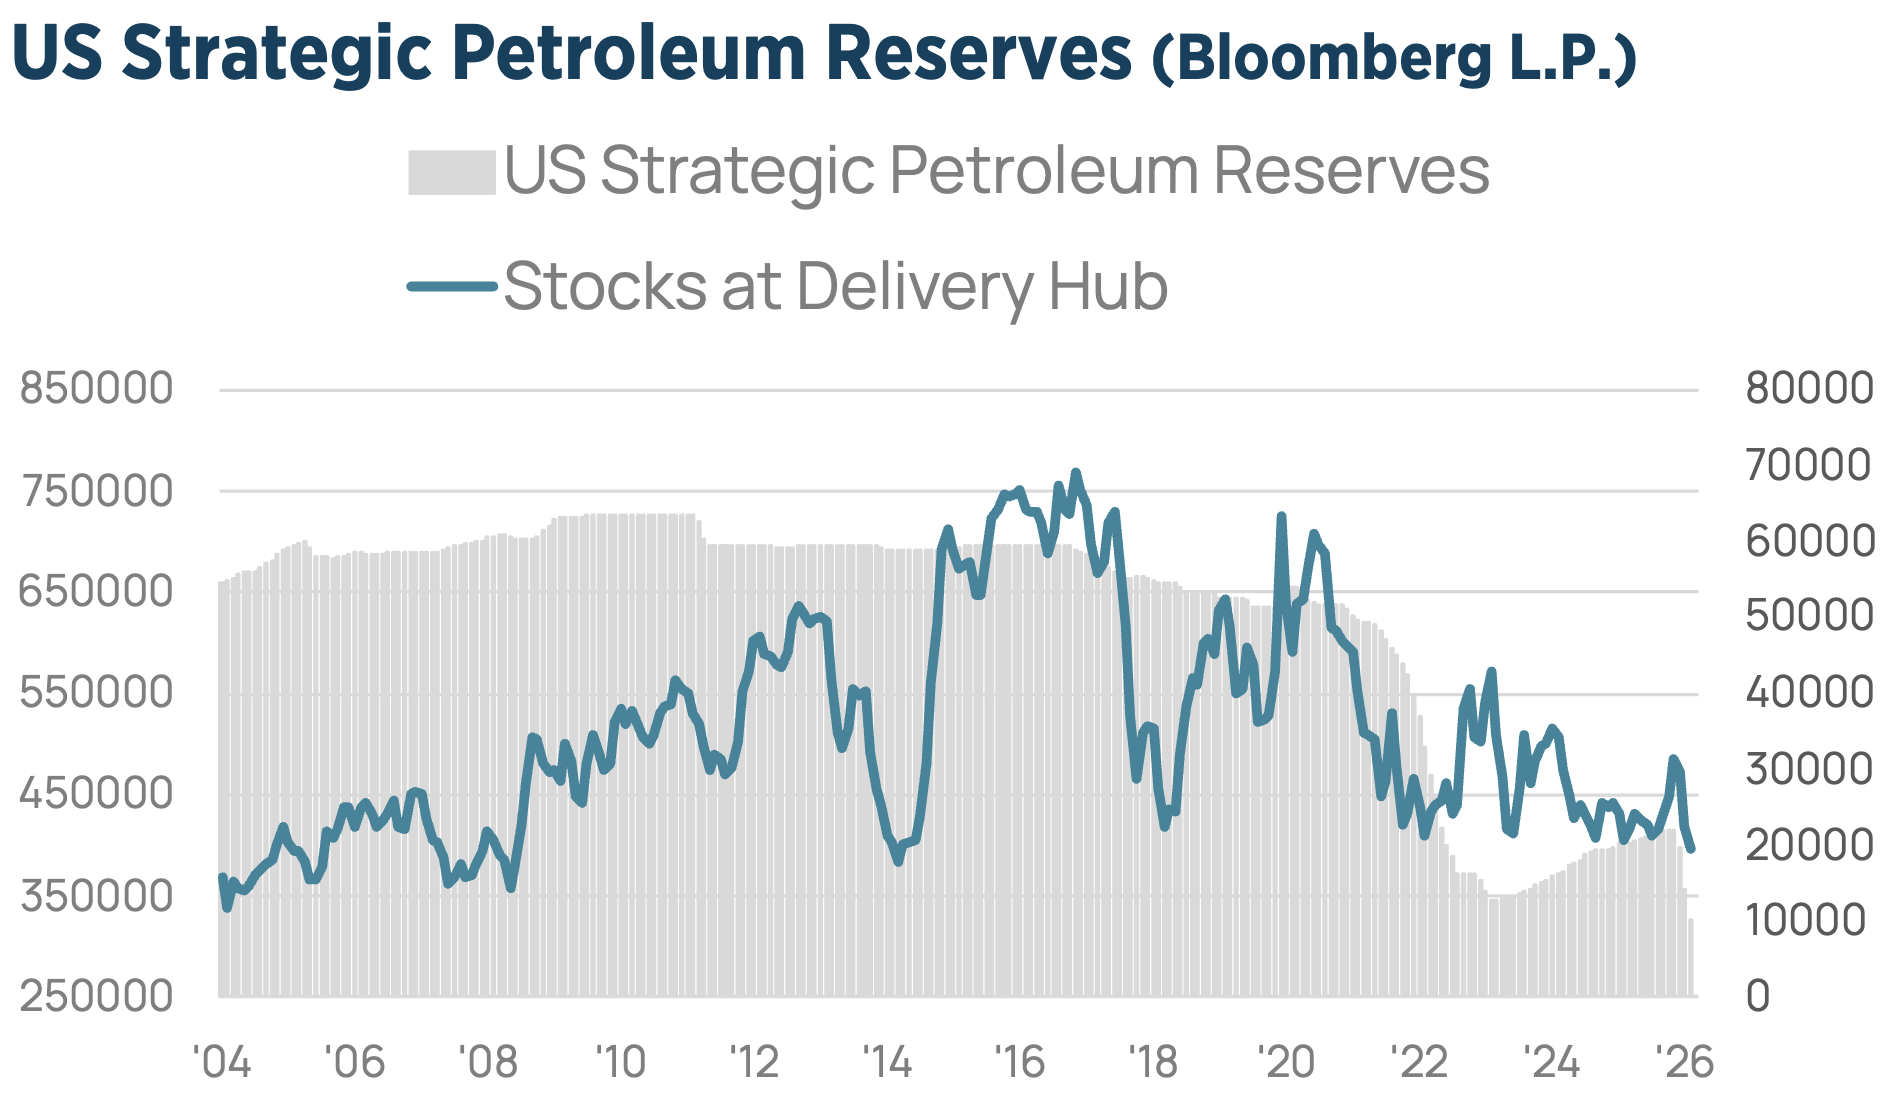
The sharp drop in oil prices masks persistent risks in the Strait of Hormuz. Global crude inventories are being drawn at an exceptional pace, with the EIA projecting stock draws of around 6.3 million barrels per day in the second quarter and 7.6 million barrels per day in the third. Inventories are also unusually dislocated across regions. Yet speculative positioning tells the opposite story: combined WTI and Brent short positions have climbed back toward late-2025 highs, leaving the market vulnerable to reversal, increasing upside asymmetry once again.
 Gold corrected sharply in the second quarter as rising rate-hike expectations and a surging US Dollar overwhelmed its traditional safe-haven appeal—even amid escalating geopolitical tensions. After more than doubling over the past three years, the correction has reset positioning and valuations. We believe this pullback is healthy rather than structural. As markets move beyond the current rates repricing, gold’s role as both a geopolitical safe haven and a long-term hedge against monetary debasement remains firmly intact. It should also be noted that a powerful El Niño pattern is shaping up to disrupt agricultural output, and historically that has meant higher grain, beans, livestock, poultry, and palm oil prices. We keep the recommended tactical allocation in commodities at neutral.
MACRO
The case for commodities is no longer simply cyclical—it is increasingly structural. Years of underinvestment, combined with rising demand from electrification, energy security, defense spending, and deglobalization, point to a prolonged period of supply constraints across many raw materials. As commodities become central to the macroeconomic landscape rather than a niche inflation hedge, we believe they deserve to be viewed as a core strategic allocation. In a world of higher inflation, greater geopolitical uncertainty, and increasing fiscal activism, exposure to real assets is becoming an essential component of long-term portfolio construction.
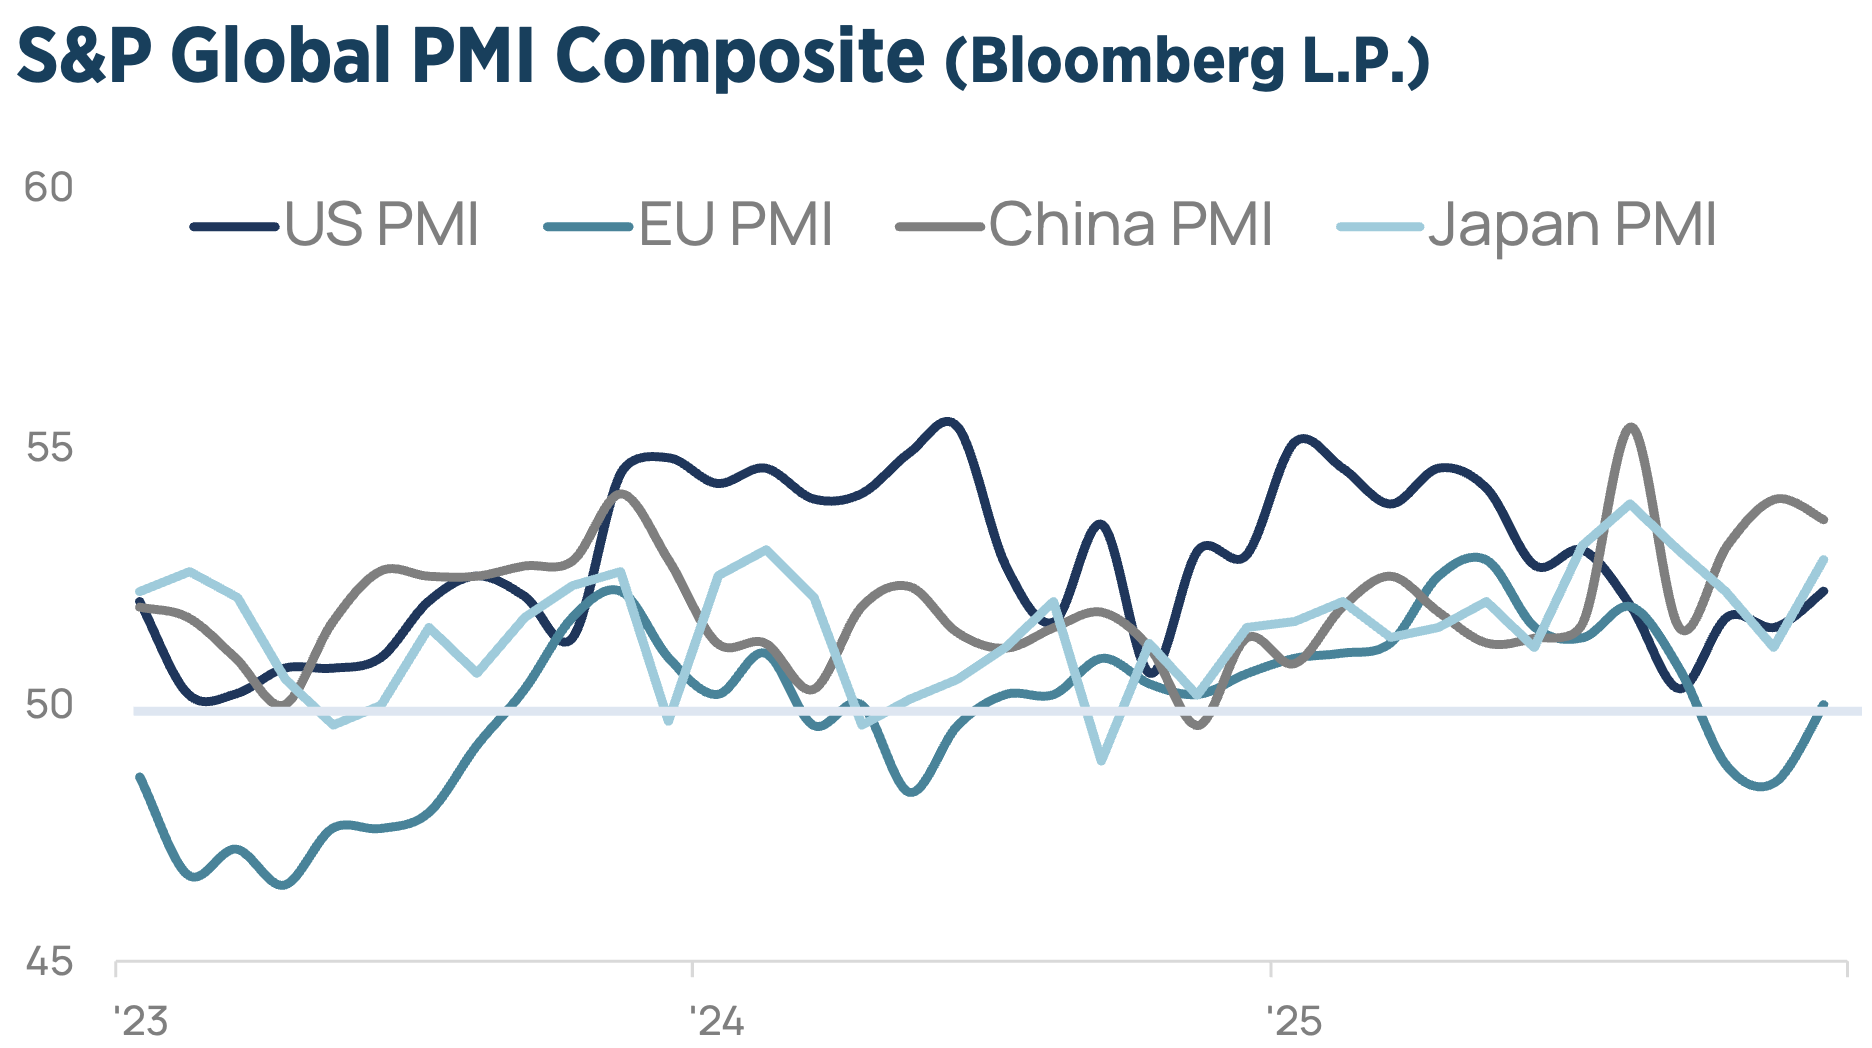 The post-Cold War era of globalization gave way to a more fragmented world, where economic policy is shaped by national security. Tariffs, sanctions, export controls, and industrial policy have become strategic tools, blurring the line between economics and geopolitics. As resilience increasingly takes precedence over efficiency, investors must adapt to a new regime in which geopolitical developments play a central role in shaping markets, capital flows, and long-term investment opportunities.
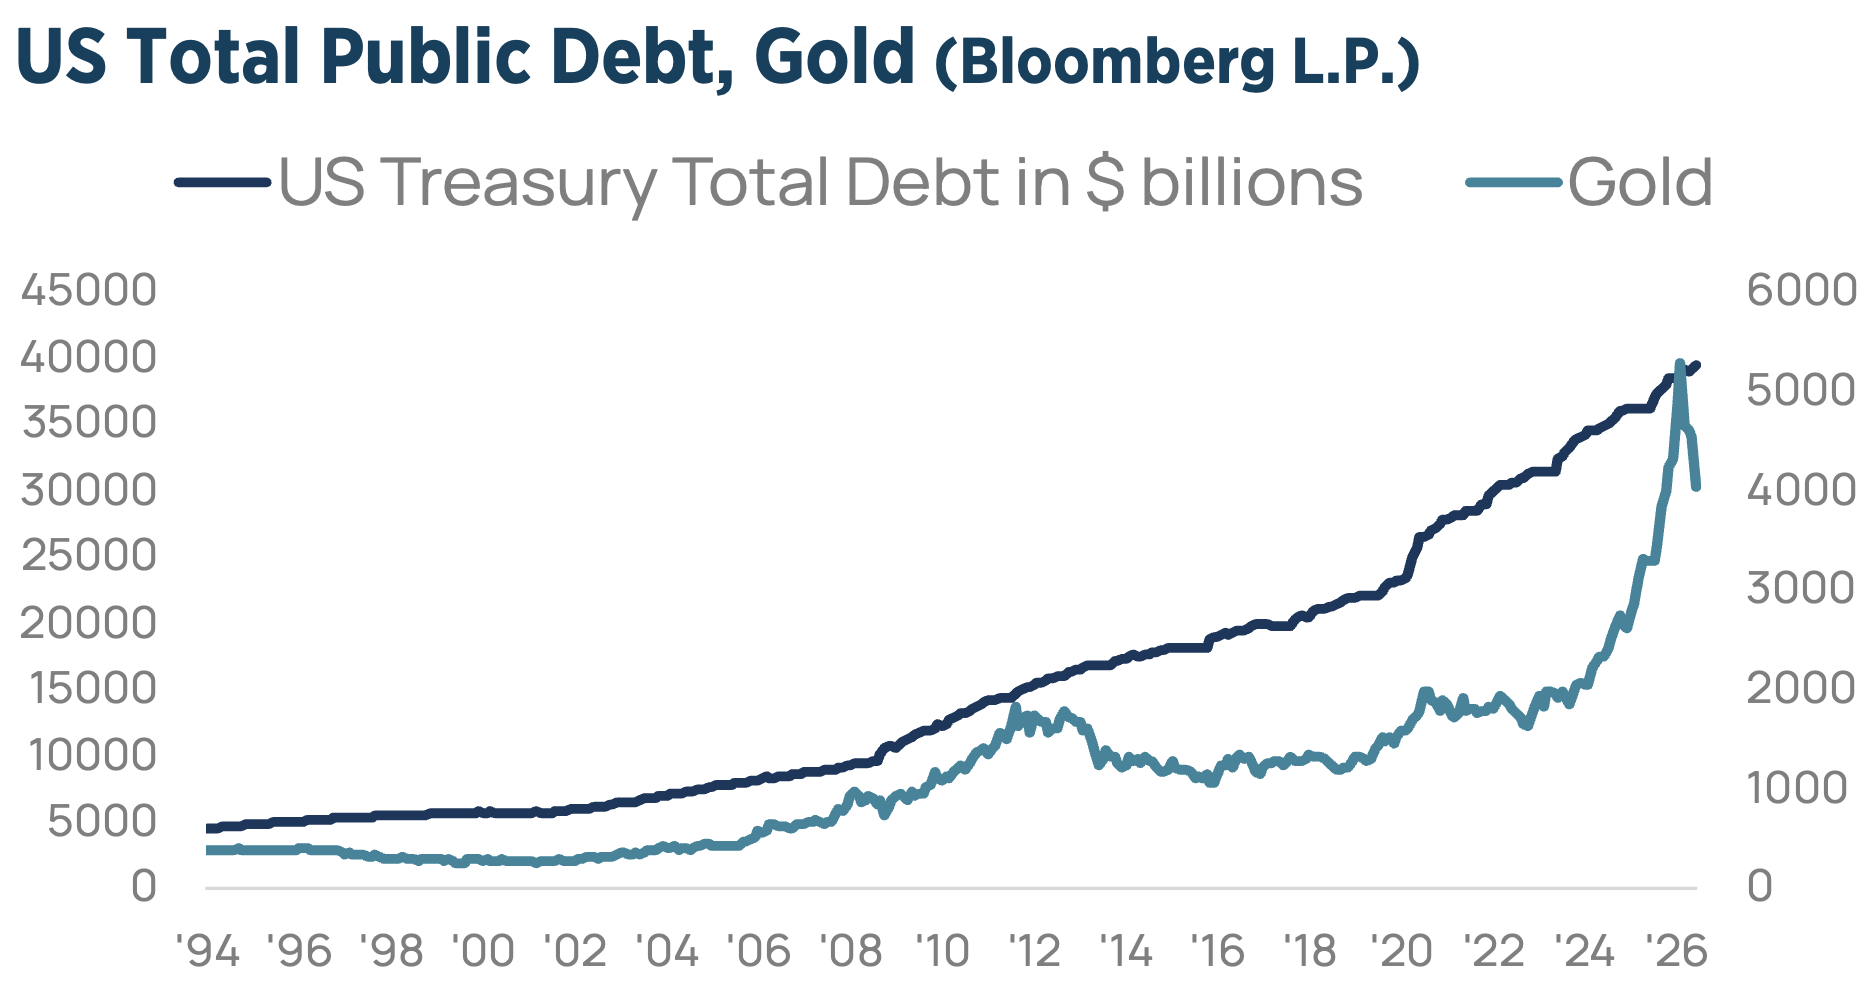 The dominant secular themes are deglobalization and innovation, both of which continue to create compelling investment opportunities. At the same time, the balance of power is shifting from monetary to fiscal policy. This evolution is not new. As we wrote in our first-quarter 2019 letter, today’s markets can only be understood through the sequence of crises and policy responses—from the corporate crisis following the dot-com bust, to the banking crisis of 2008, and ultimately to the sovereign balance-sheet expansion that followed unprecedented monetary intervention.
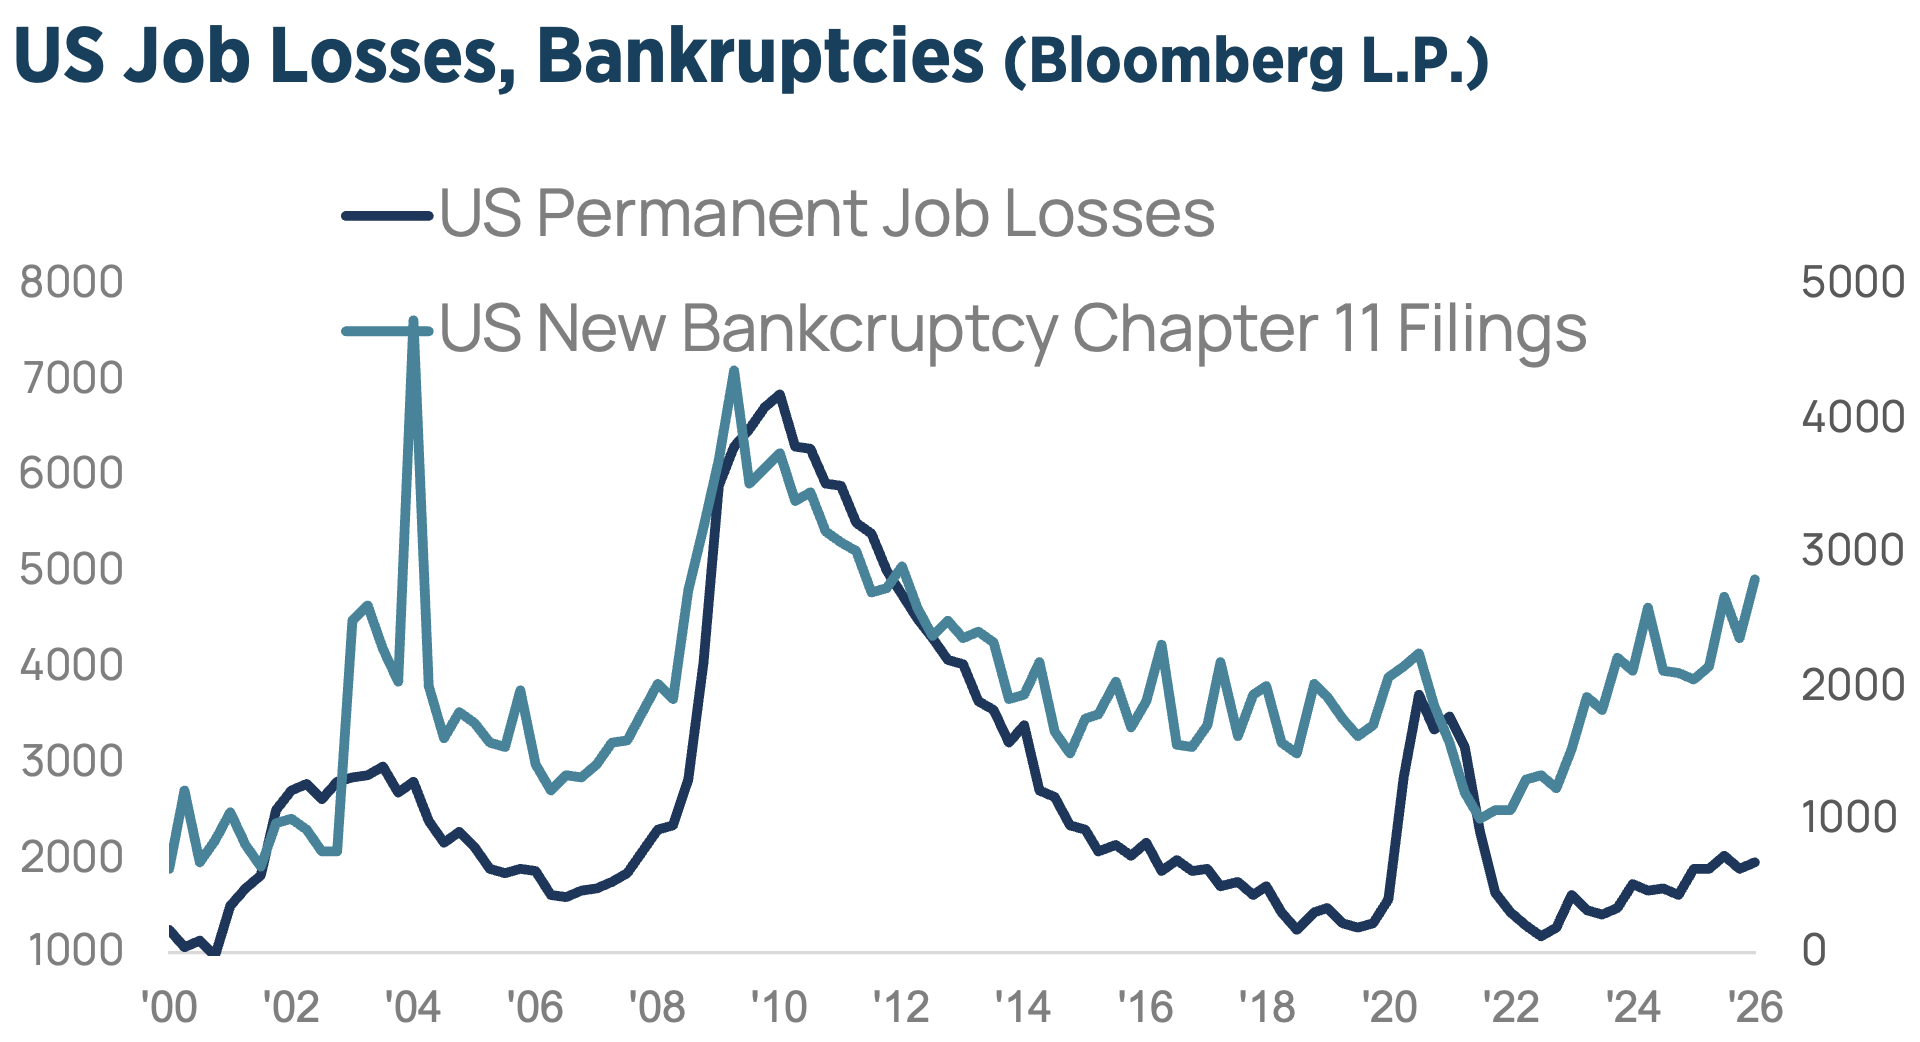 The 2008 financial crisis was a structural turning point whose consequences are still unfolding. The pandemic marked another regime shift, ending the four-decade bull market in bonds and ushering in a new commodity cycle. While these secular forces shape the investment landscape, liquidity remains the dominant cyclical driver of financial markets—and increasingly, of the broader economy itself.
TACTICAL ALLOCATION
 The inflationary forces are structural and secular, on higher debt-load, demographics and on-shoring of manufacturing. We had been in an interim period from 2022-2025 with significant disinflation. As it turns out, unsustainable sovereign debt dynamics and wars can create bidirectional feedback loops. Wars generate more unsustainable debt, while high debt levels can force critical political decisions that spark war.
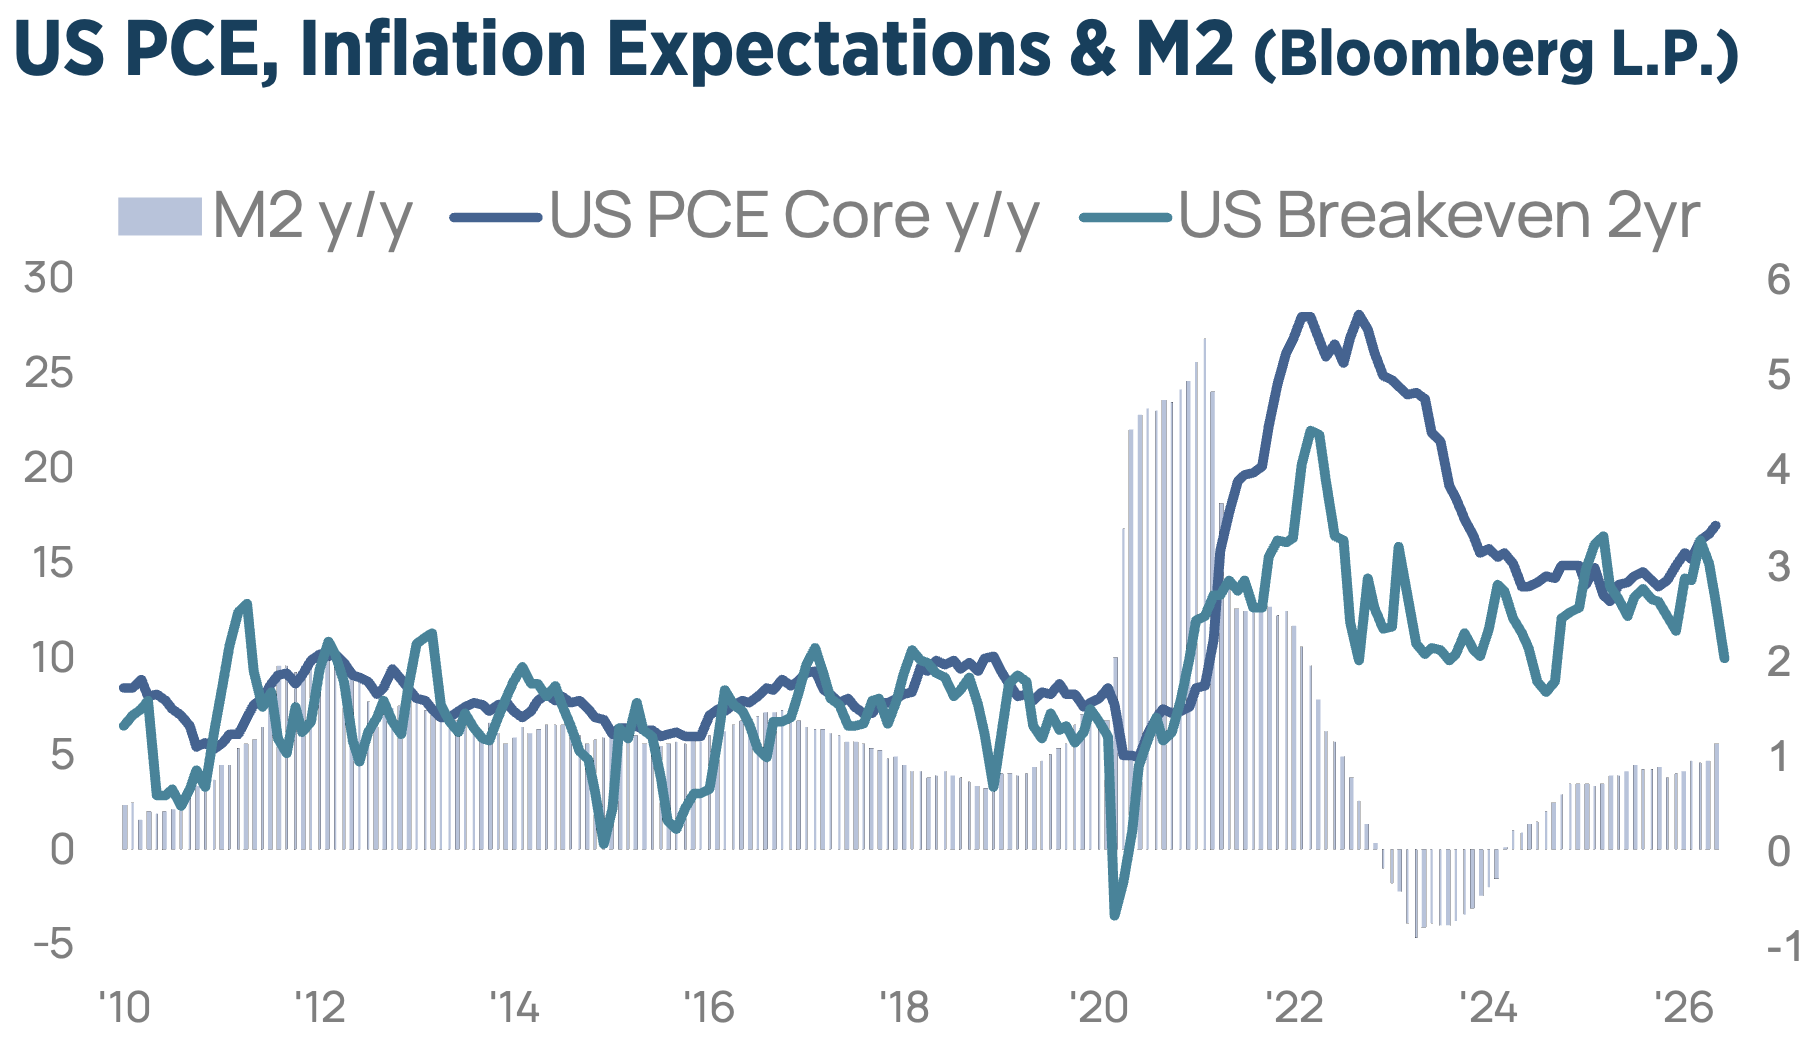
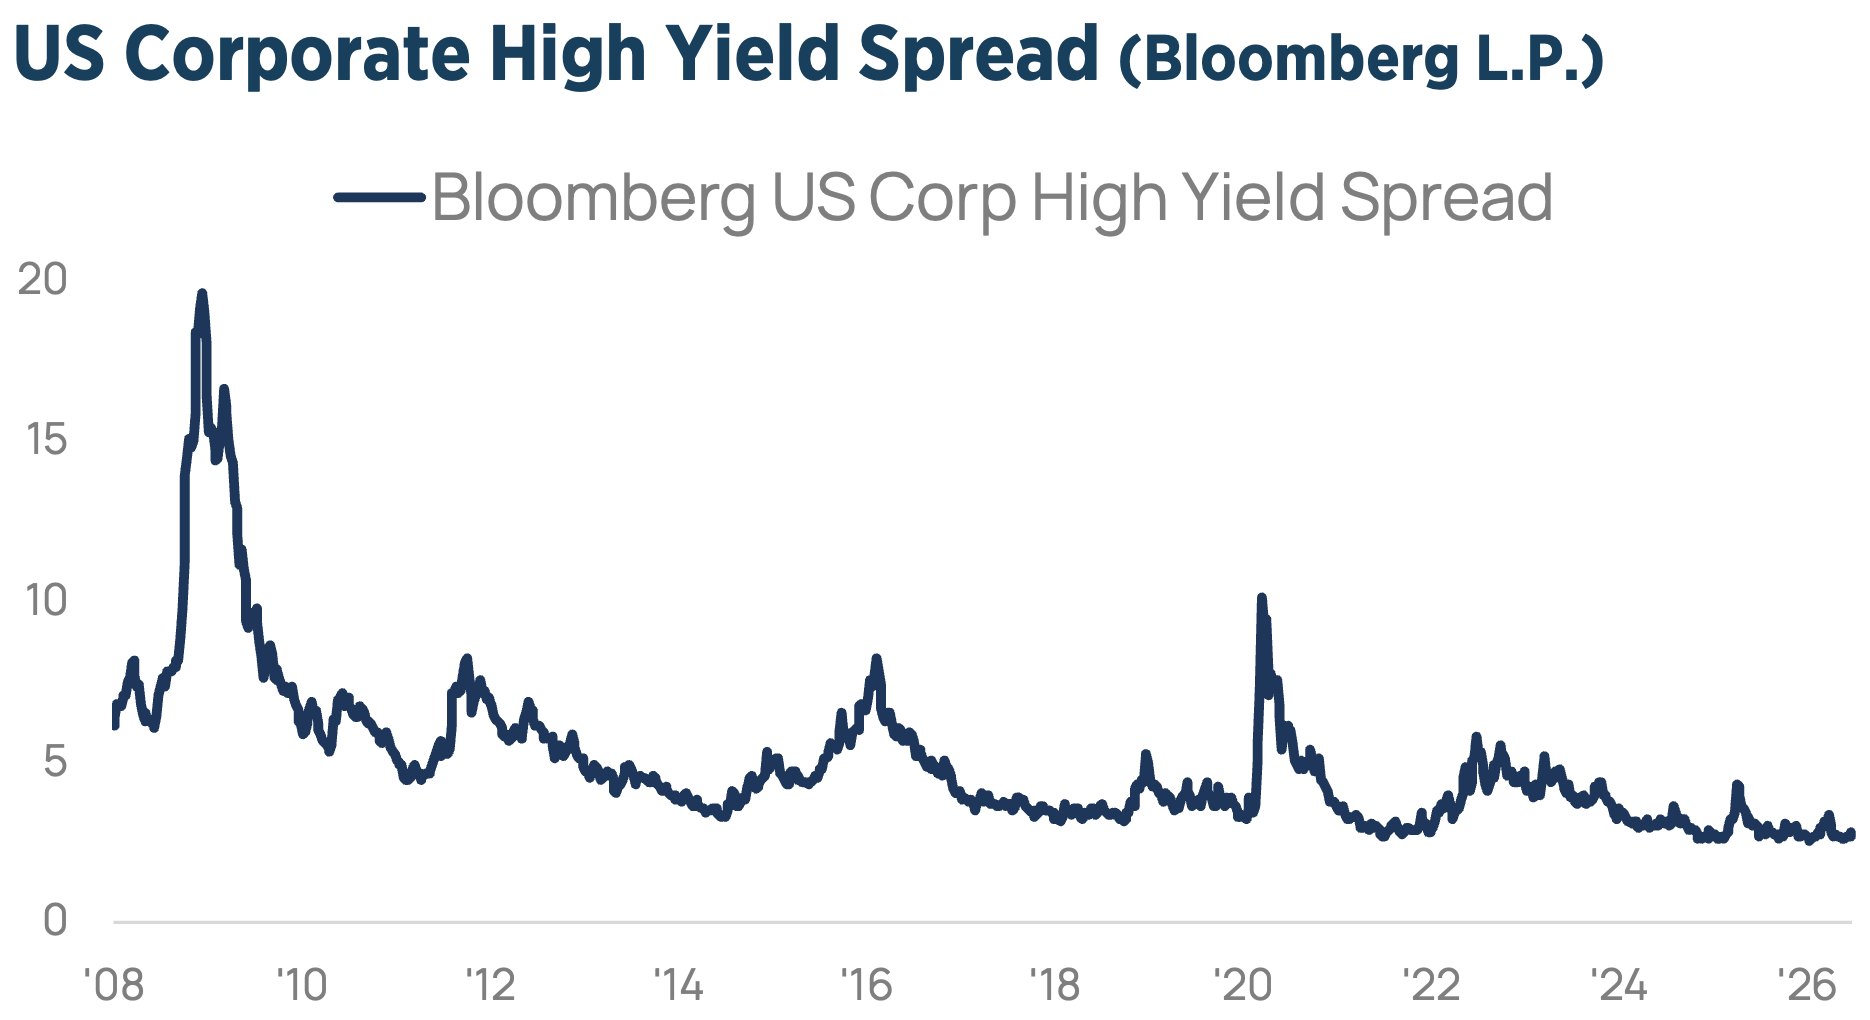
From a tactical perspective, inflation continues to send conflicting signals. Realized inflation has re-accelerated, with both CPI and PCE remaining above central bank targets, while supply-chain pressures, although easing in June according to the NY FED’s Global Supply Chain Pressure Index, remain elevated. The sharp decline in oil prices is likely to produce softer month-on-month inflation prints in the near term, but year-on-year measures are expected to stay relatively high. Meanwhile, inflation expectations are diverging: consumer surveys point to a de-anchoring of expectations, whereas market-implied inflation expectations have moved lower, in some cases falling below pre-war levels. This divergence underscores the high degree of uncertainty surrounding the inflation outlook and the path of monetary policy. We are tactically raising our fixed income allocation to neutral. Current level of yields provides interesting carry opportunities in bonds. The cooling US labour market together with lower oil prices give policymakers greater scope to pause and assess incoming data. Within fixed income, we continue to favour investment-grade, while we remain underweight high yield, as credit spreads are too narrow. Private credit concerns remain.
S&P500 & VOLATILITY
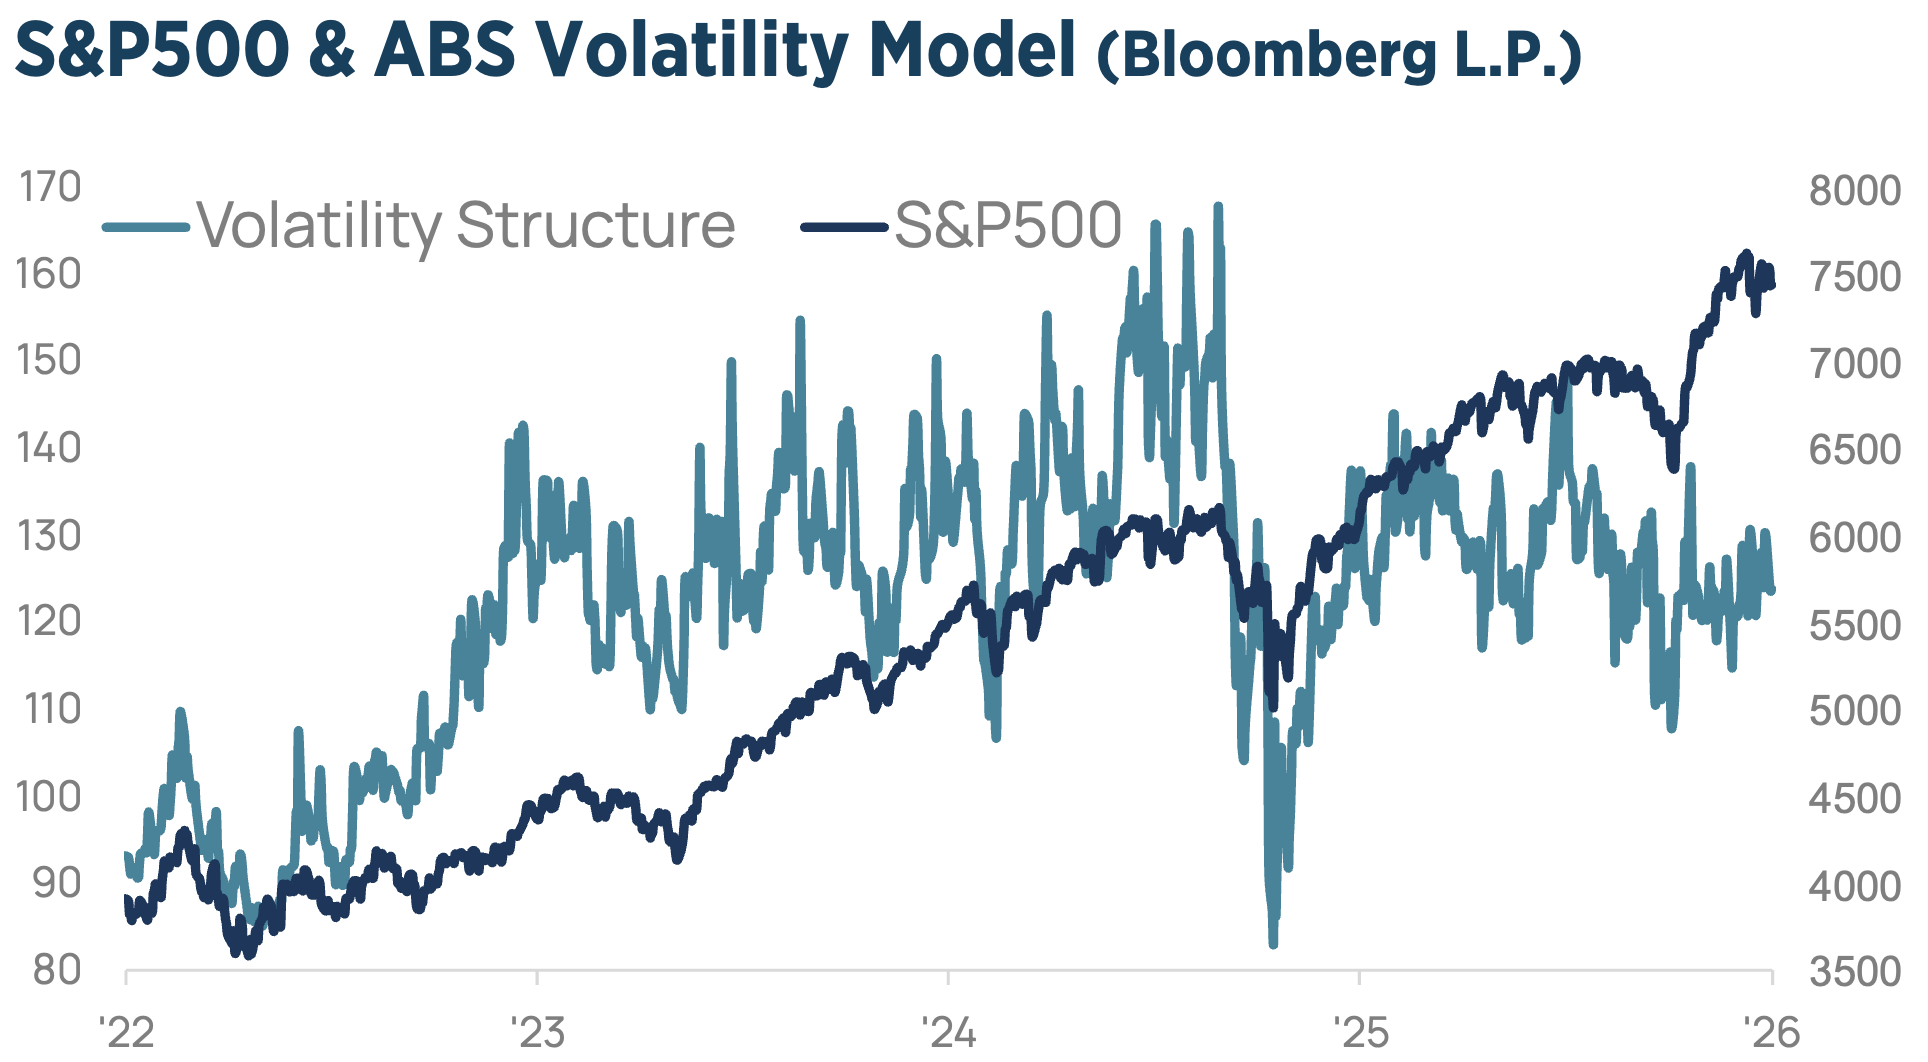
The current investment upswing has now lasted 44 months, dating back to the October 2022 liquidity-cycle low. Equities have evolved from a passive reflection of the economy into an active driver of it, with rising asset prices reinforcing confidence, spending, investment, and ultimately earnings. As AI remains the dominant force behind equity performance, investors will need to become more selective. We continue to favour AI infrastructure and equipment suppliers, where demand visibility remains strongest, while becoming more cautious on hyperscalers, as questions emerge over the sustainability of their capital spending.
At the same time, market risks have become increasingly asymmetric: equities are at record highs, oil prices have fallen sharply, stock-bond correlations have fallen to multi-decade lows, and equity funding have become more challenging. The unusual backdrop warrants close monitoring. For now, we continue to see a more attractive risk-reward profile in US equities than in European markets.