
GLOBAL STOCK MARKETS
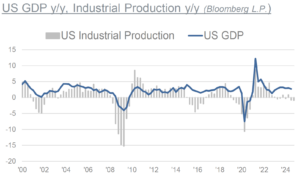
The fourth quarter capped off a year that most investment houses had not expected.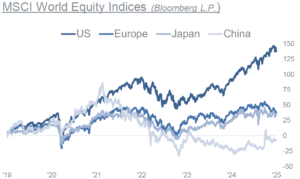 The consensus was for lower economic growth. The economic forecasts, according to the Bloomberg survey, showed that strategists expected US growth to be around 1.3% in 2024, about half what the growth rate appears to be. The S&P500 was expected to remain flat. The debate at the time was about soft landing vs hard landing and whether recession risks were still elevated. Looking back, the main investment topics revolved around inflation, central bank rate policy and the US election.
The big tech stocks were once again the focus, while the dire geopolitical situations continued not to play a significant role for the financial markets.  The outcome of the US elections has provided both clarity and uncertainty for 2025. While on the one hand the election result was clear and undisputed, things remain unpredictable with regard to the incoming Trump administration. Investors have priced in the positive aspects of Trump’s election program, particularly, deregulation, tax cuts and the relative growth advantage of the US economy versus its trading partners. However, the manner and the speed with which the Trump administration will or can implement, will be asource of uncertainty.
The US Dollar and US equity markets have sharply outperformed most other markets since the election. On a short-term basis, the outperformance is justified, as the US already benefits from a relative growth advantage and will likely benefit further from tax cuts and economic protectionism. The medium-term is more uncertain, as import tariffs and plans to deport immigrants are likely to stoke inflation and possibly reduce economic growth.
Europe currently appears to be in a weak spot; growth has been around 1% for several years. Its two main economies, Germany and France, are facing political uncertainty. With a likely trade war with the US, China needs to boost the domestic market to offset the possible loss of some exports. The authorities have announced a series of measures to support the economy and financial markets. So far, it has failed to convince investors. 2024 has been a good year for investors, despite the tense geopolitical environment and below-trend growth in Europe and China. There could well be a more balanced development in 2025, as the valuations and investor sentiment differentials between the US and the rest of the world seem extreme.
The S&P500 returned 25% in 2024. 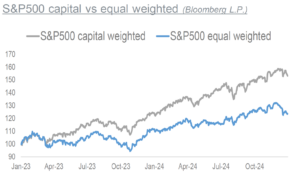 Yet, there has been a huge disparity in performance across stocks, sectors, styles and geographies. Excluding the largest 6 tech stocks, which make up 31.2% of total market cap, the returns would have been 16%. This high concentration not only affects the performance in the US, but also the MSCI World Index, where among 23 markets, the US’ share has increased from 57% to 74% in the last 10 years. The MSCI World returned 19%, excluding US 5%.
GLOBAL FIXED INCOME MARKETS
In contrast to stocks, global bond markets had a challenging year. The rollercoaster ride continued into 2024. At the start of the year, analysts on average expected the US 10 year yield to close 2024 at 3.80%.
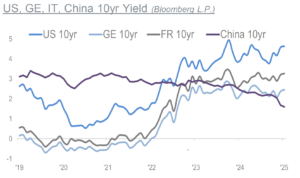 By the start of the fourth quarter the forecast seemed well on track. However, fixed income markets experienced considerable volatility in the last quarter. After June was the first month in four years, that no central bank hiked rates, the bond markets had transitioned to a positive third quarter. However, this changed around the FED meeting in September, even if the FED started its long-awaited cutting cycle with a 50bp move. US Treasuries got under pressure over potential inflationary policies, as markets started to price in higher probability of a Republican victory in the presidential election. An uptick in inflation figures added pressure for yields to rise. At the December meeting, the FED cut rates for the third consecutive time, bringingthe target range to 4.25%-4.5%.
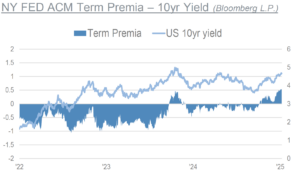
However, FED Chair Powell cited then, that fewer cuts might follow due to persistent inflation concerns. Markets were spooked upon realization that the FED’s focus returned firmly to inflation. Many see this as the signal, that the FED has abandoned its inflation target of 2%. It projected inflation to be at 2.5% at the end of this year, up from September median of 2.1%. The stronger focus on inflation is a significant shift in strategy from September, when the FED saw labor market softening as the greater risk. The US 10year yield finished the year at 4.57%.
The term premia, the extra return that lenders demand to hold alonger-term bond instead of investing in a series of short term-term securities, increased considerably, although from depressed levels. Higher term premia result from greater uncertainty on higher inflation outcomes, as well as when it comes to the relative supply and demand of US Treasuries.
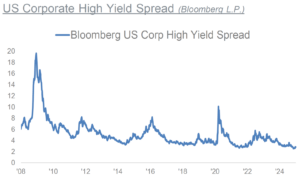
 The ECB cut rates by 100 bp as well, leaving the base rate at 3%. However, fiscal worries and political instability complicated the landscape. There have been two main engines of world growth in recent years, Chinese industry and US government spending. While questions hang over the sustainability of the US fiscal deficit, Chinese stimulus has so far not changed the deflationary direction of its bond market. Chinese policy makers have continued to target a stable Yuan, despite debt deflation and the need for devaluation. In 2024, credit volatility has been low, while interest rate volatility has been high at times. Credit spreads entered 2024 at already very tight levels, and they have continued to tighten based on attractive all-in yields andstrong demand.
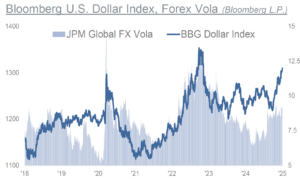
US DOLLAR
The Dollar remains the name of the game. That may still sound trite, but it remains central to the capital markets. With the prospect of rate cuts in the US, the Dollar had softened in Q3. However, things decidedly changed in the last three months. The Bloomberg Dollar Index was up 8%. Currencies like the Brazilian Real and the Indian Rupee fell to new all-time lows vs the Dollar. A strong Dollar is an impediment to global liquidity. The Dollar’s strength appears set to hold into 2025 amid a supportive US economic and fiscal backdrop.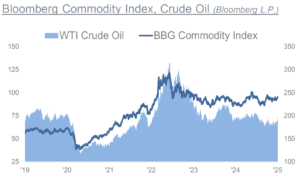 Beyond the Dollar view, given a highly uncertain international economic and political climate, current dynamics increase the appeal of defensive currencies. According to Bloomberg, the Dollar’s share of payments via SWIFT increased to 47.7% from 41.8% since 2023. Euro’s dropped to 22.3% from 36.3%, Yuan increased to 3.9% from 2.1%.
COMMODITIES
The Bloomberg Commodity Index was flat on the quarter. Energy was the strongest component of the index, up 5%. Industrial metals fell by -8%. Over the year, the index was 5% higher, led by precious metals, with the sub-index rising a whopping 25%. The agriculture sub-index posted a modest loss. Gold continued to new all-time highs, moving to $2’790 by the end of October. It has been in consolidation mode since.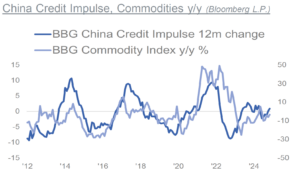
Geopolitical tensions and central-bank buying remain gold underpinnings. On the other hand, the data from the largest Gold-ETFs show, that investors have been significantly lowering their exposure to Gold over the past four years. However, the data since August suggest, that flow into the ETFs are coming back.
Industrial metals are dependent on recovery in China, facing US tariffs. Though the risks are skewed to the upside, if China follows through with a concerted stimulus push. OPEC+, which previously planned to start rolling back production cuts, extended the 2.2mbd agreed in November 2023 until April 2025.
 While the technical picture of WTI Crude has improved in recent weeks, concerns remain, over soft global demand and continued non-OPEC+ supply growth. Longer-term, AI’s growing demand for power, will add to the investment case for key metals. Whether copper for grid expansions and upgrades, or uranium to meet growing low-carbon energy needs. We keep the recommended tactical allocation in commodities at neutral. We remain strategically positive on precious metals. However, we would not be surprised, should Gold continue the consolidation phase for a bit longer.
MACRO
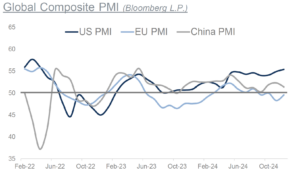
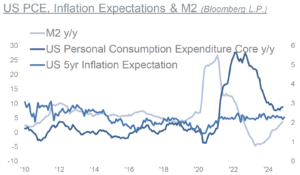
Market-based inflation expectations, which are important to monitor, have stayed closer to 2% for most part since the beginning of 2021. The disinflationary forces have been playing out and inflation data have slowed significantly from their 2022 peaks. US headline inflation has fallen to as low as 2.4% y/y in September,however was at 2.7% in November. The FED’s preferred gauge, PCE, has fallen to as low as 2.6% inJune and then rose to 2.8% in November. What seems to prove the stickiness of inflation above the 2% target. Latest Global PMI data signal that global economic growth improved at the end of 2024. Employment increased slightly due to more new orders coming in. The growth was mainly driven by the services sector, especially financial services. Manufacturing output, however, decreased during this time. Different regions experienced varied growth rates, with the US and India performing better than other major economies. Business confidence declined in the same period, with worries about geopolitical issues and protectionism affecting the outlook.Global trade, on the other hand, has contracted further. While we wrote about soft landing in our 2024 reports, as the macroeconomic outlooks seemed clearer, other questions arise when we look to 2025.
 We have covered in the previous reports, that high levels of government debt raise concerns about their long-term sustainability and potential impact on economic growth. It highlights the darkening fiscal outlook and the governance challenges. Rising global bond yields, and rising bond term premia, are expressing these risks. The Treasury Department of the outgoing US administration, to finance the fiscal deficit of 7%, had offset the FED’s quantitative tightening by increasing the share of total issuance for Treasury Bills beyond the norm. The new US administration has vowed to bring down the fiscal deficit to 3% of GDP by 2028, ramping up real GDP growth to a 3% via large-scale deregulation, and boosting oil production by a sizeable 3 million barrels daily. While this is likely to boost the Dollar; how will this affect global liquidity?
 New US Treasury Secretary Bessent has vowed to return to using longer-datedcoupons to fund government. Longer duration securities require greater balance sheet capacity by banks, which has a negative impact on liquidity. Therefore, the global liquidity outlook for 2025 looks different than it was in 2024. China needs to monetize out of the debt problem,but so far, shows no intention to let its currency devalue. With the Western governments struggling too, due to the fiscal deficits, the alternative is the monetization of public deficits. With the US having the world’s reserve currency, it looks more manageable for the Dollar.
TACTICAL ALLOCATION
 The inflationary forces are structural and secular, on higher debt-load, demographics and on-shoring ofmanufacturing. We have been in an interim period for the past two years. Inflation risks appear to have picked up at end of 2024. For 2025, the market currently prices in one 25 bp cut by the FED and a total of 75 bp cuts by the ECB. Analysts on average expect the US 10year yield to close 2025 at 4.16%. We recommend a neutral allocation in fixed income. We stay neutral on high yields and keep our preference for investment grade. Selectivity and diversification is key. We are mindful of the developments in the commodities, for signs, should inflation risks accentuate.
S&P500 & VOLATILITY
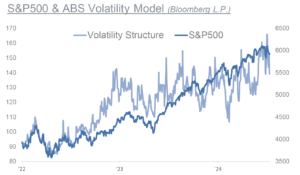 Looking at 2024 reveal a huge disparity in performanceacross stocks, sectors, styles and geographies. We believe 2025 will likely see a more balanced performance. While Trump’s reelection was the most noteworthy headline, a better than expected economy was an important driver too. Global manufacturing is undergoing a profound transformation, the relocation of production is not a temporary trend. The US is at the dawn of a reindustrialization era, what represents a multi-decade investment opportunity. Analysts expect the earnings growth rate for the S&P500 at 14%, above the trailing 10-year average of 8%. The S&P500 is seen to gain 10% in 2025. We keep our overweight allocation in equities following the Trump election. We are overweight on US, remain neutral on Europe and China,and underweight on Japan. While there is no historical analogy to the current environment, we focus on high quality and diversification remains key.