Bitcoin Short Term Chart
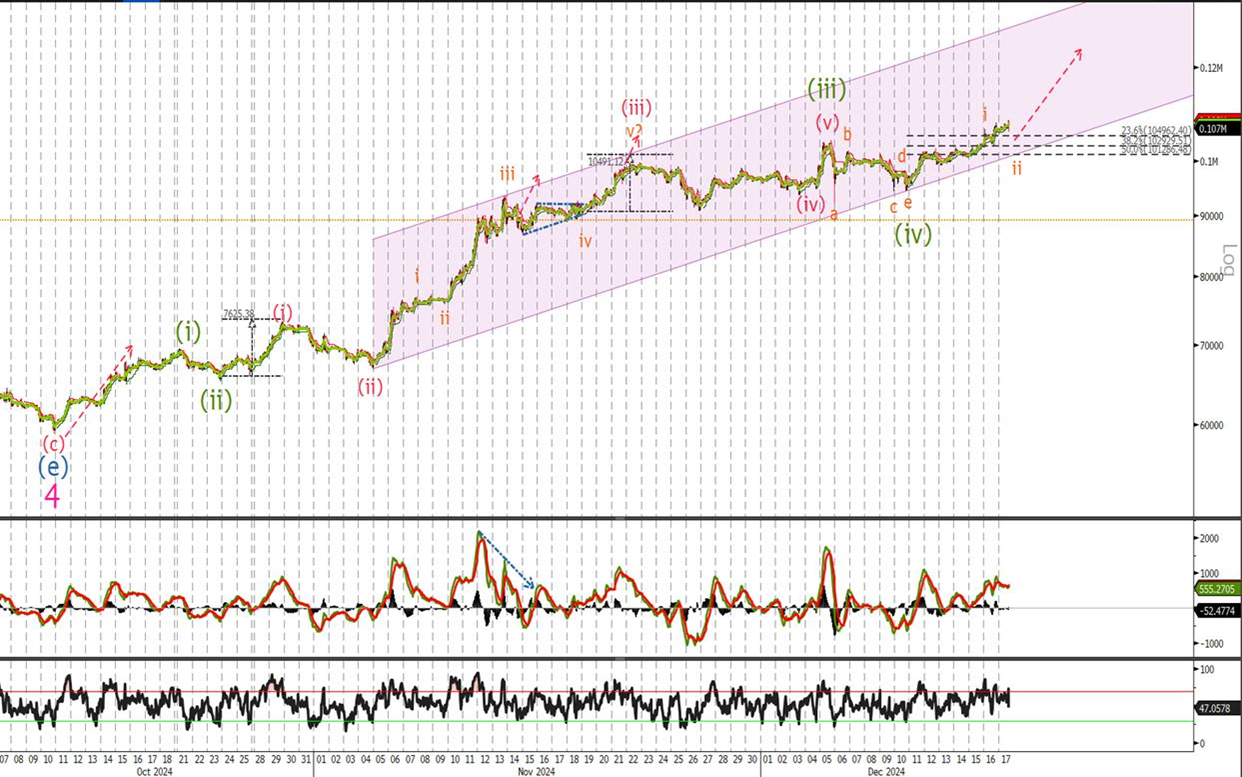
It looks to me that we are the start of the final leg higher in this current run. As you can see the trend channel along with the retracement levels all lie in the 101300 – 104960 area and if not long already I would buy now as we are slightly off the highs or leave a order to buy in the levels mentioned before. A move below 94700 would result in a reassessment of this wave count but not the over all longer bullish view still.
Ethereum chart
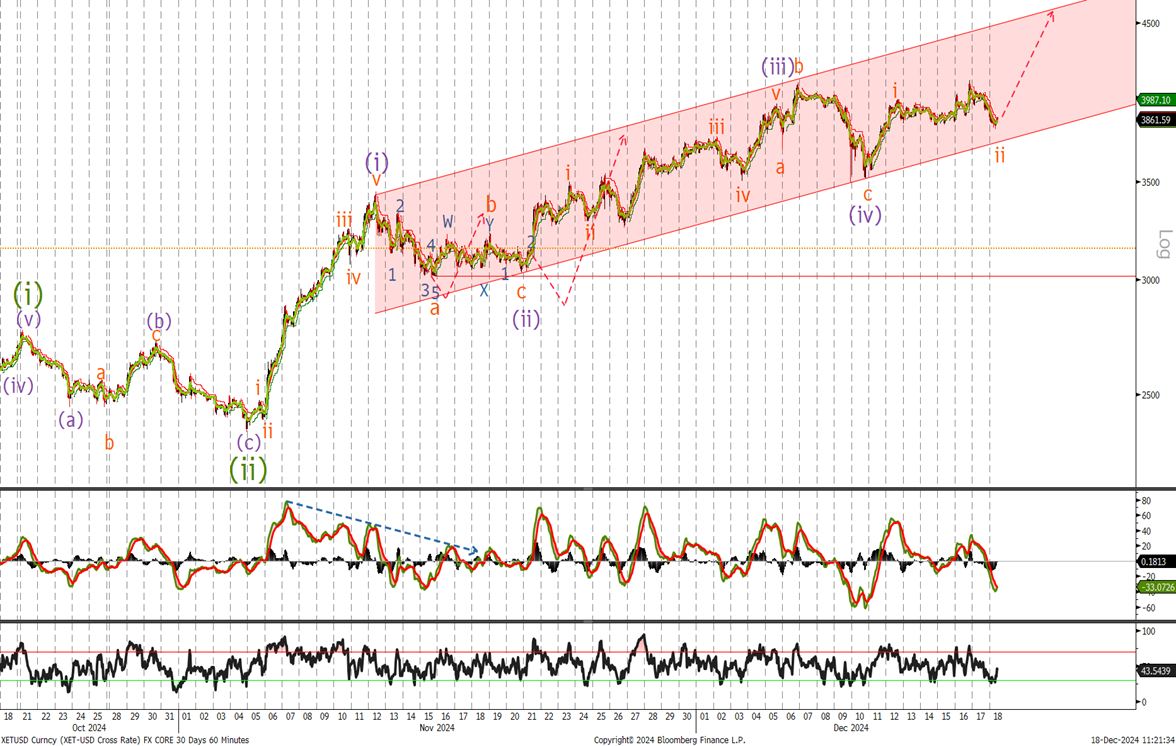
Last time we said ‘I will use any pullbacks in to the 2895-3025 area to add to longs. Raise stops to 2325 level now expecting much higher in the coming months.’ We just missed the chance to add to long positions with a low of 3032 just 7 dollars away from out first buy levels. Since then we have continued to grind higher despite a fall in momentum like BTC I am happy to buy now with a move back below 3000 level not negating the bullish , but a larger than expected correction . Remain long and buy on dips.