Ethereum Long Term Chart
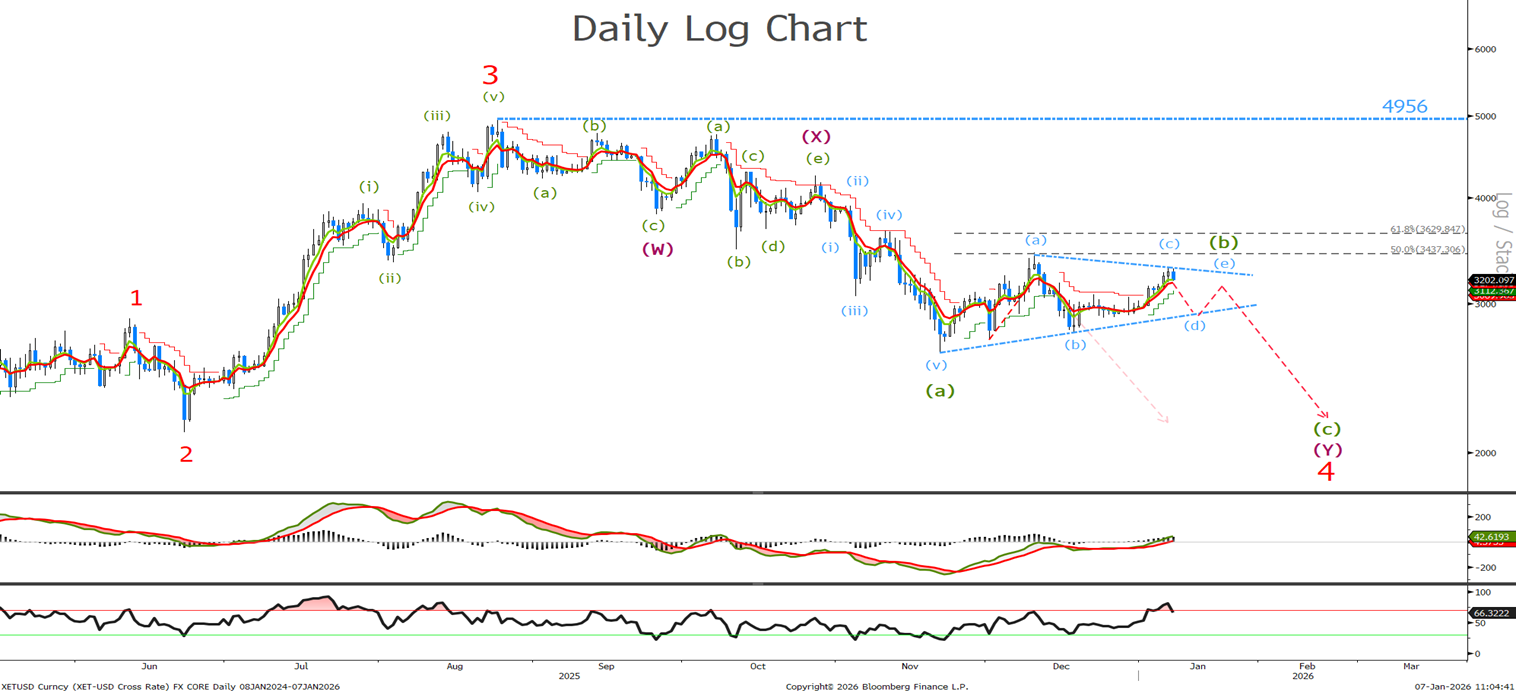
Last time I said ‘we should see a sell off anytime soon. Sell again at 3430 and lower stops to the wave (w) low at 3827.’ Like BTC we have been ranging for several weeks now and it appears we are tracing out a corrective triangle that should turn from below 3450 with confirmation that wave C is underway on a break below 2774. A move above 3450 will target 3629 and we would sell there with stops remaining at 3827.
Ethereum Short Term Chart
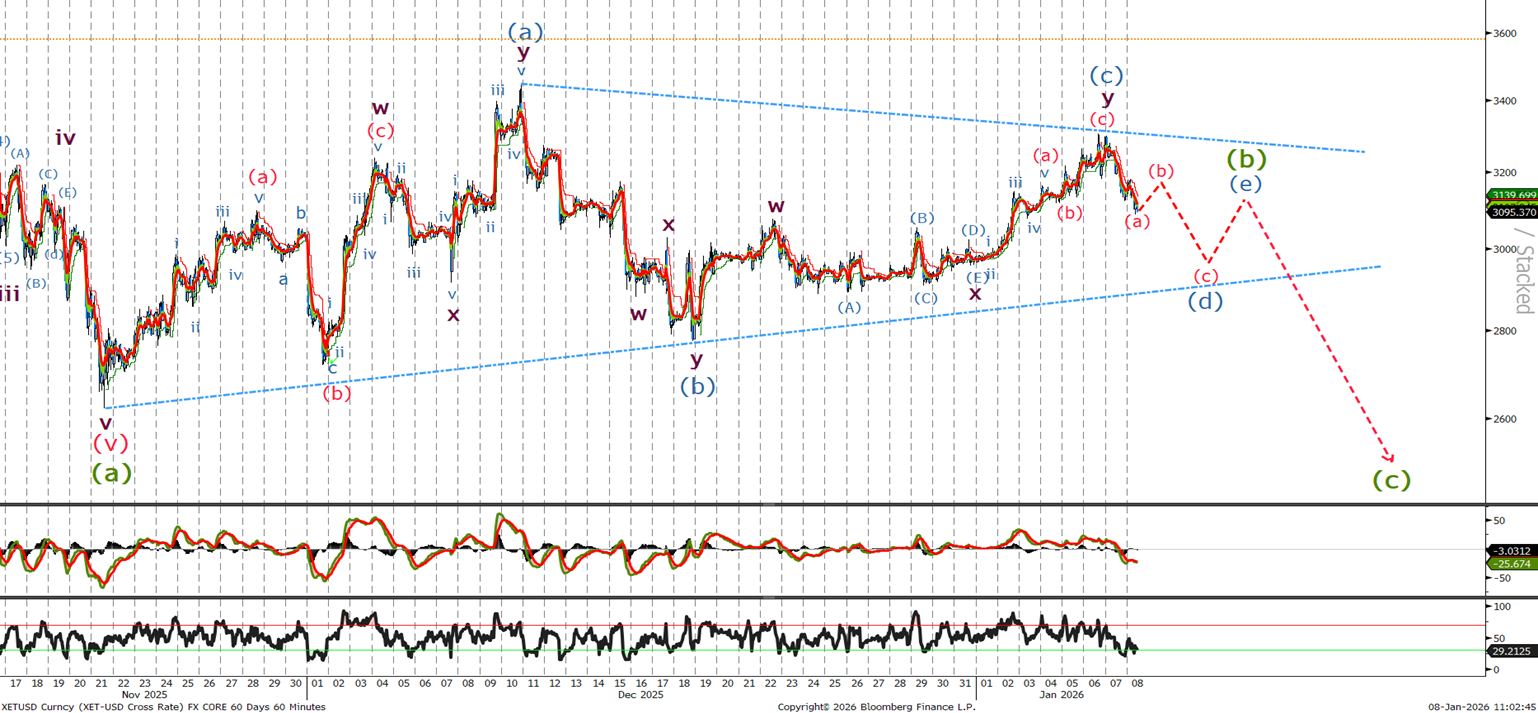
Last time I said ‘We have sold at 3240 and if not short sell now at 3160 with stops above 3700 for a push below 2500.’ As previously mentioned it appears we are tracing out a triangle , if not short sell now at 3106 and lower stops loss levels above the wave (a) at 3450. A move above may signify a larger zigzag correction is playing out. Trading above 3700 will necessitate a change in the view and could signal the bullish trend has resumed.