Ethereum Long Term Chart
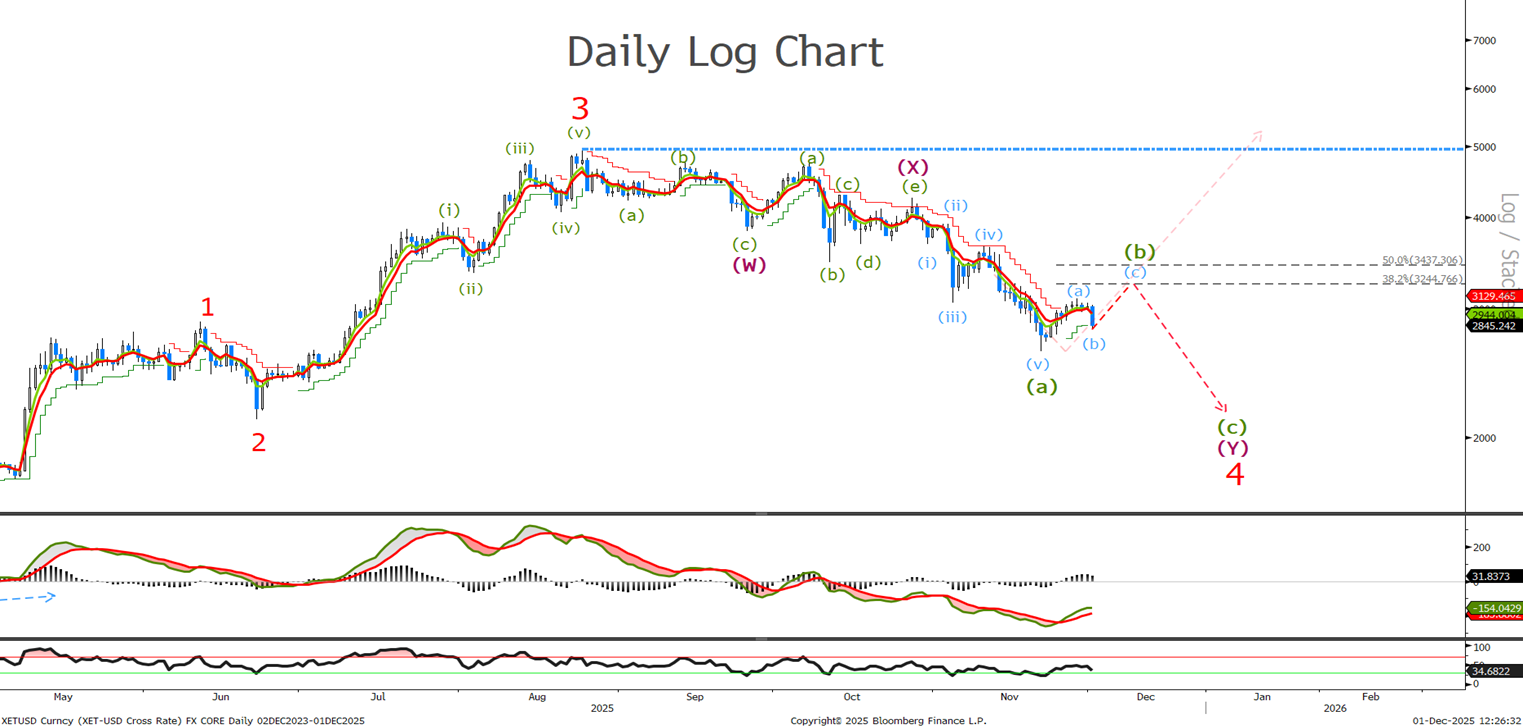
I have relabelled the daily chart that currently calls for a correction up towards the 3244-3437 level to complete the third wave of the wave (b) correction before another sell off in 5 waves lower to complete wave 4. Look to sell up there with stops on a longer term basis above 4200.
Ethereum Short Term Chart
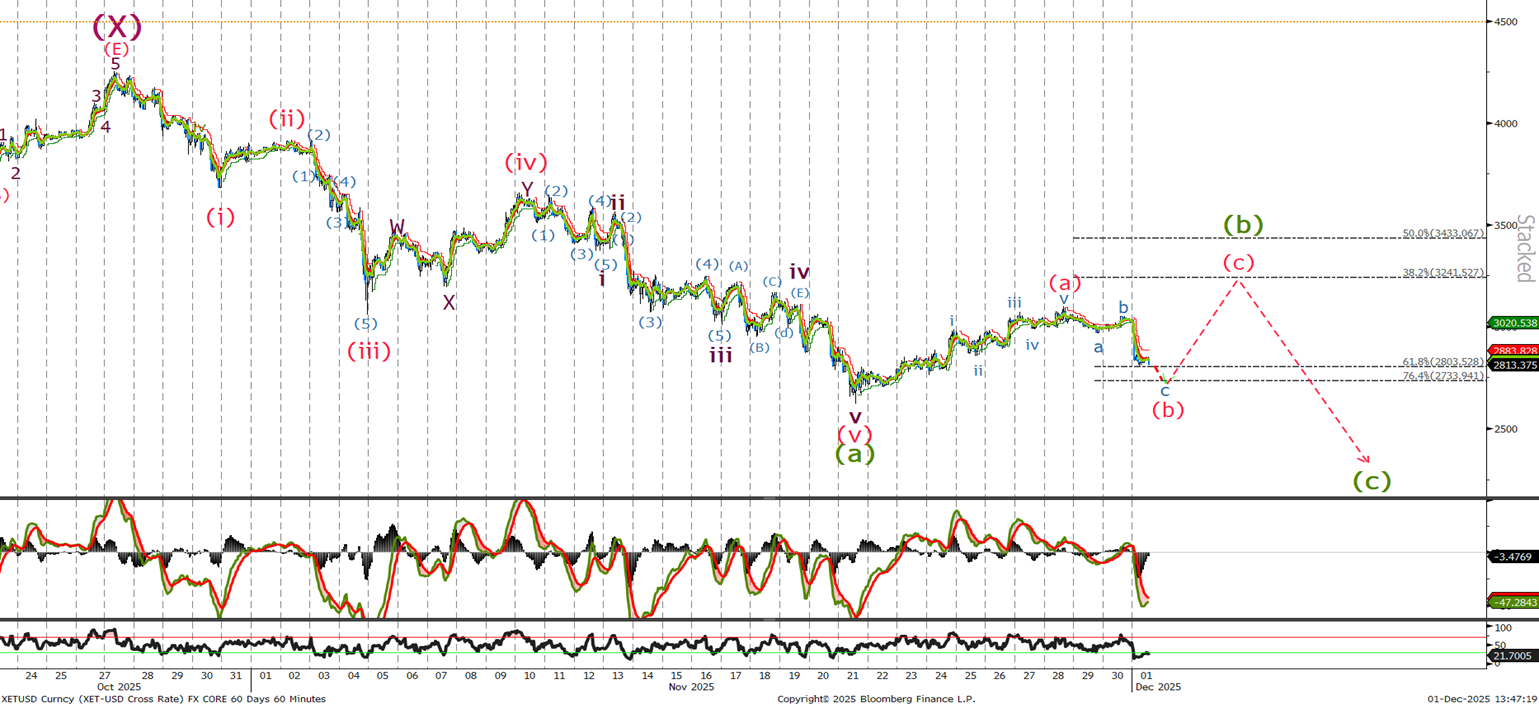
Last time I said ‘This looks to me like a wave iv and we should see one final push below 2600 to complete 5 waves and present a great buying opportunity towards the 2500 level.’ We traded down to 2600 before rallying to 3098 to complete wave (a). With this mornings sell off we are currently testing the 61.8% retracement level at and I am expecting ETH to hold around here or slightly lower at 2733. Look to buy there with stops below 2620, Looking for a push up to 3240 and possibly 3420 where we will sell ETH with a target to the down side in 5 waves for wave (C) around the 2230 level. Stops are far away at 4260 on the topside.