Ethereum Long Term Chart

The ETH fell inline with expectations as we approach the 76.4% retarcement level at 2785. There is no sign of divergence in the daily but lets look to the short term chart to see if there are any clues there as it appears wave (c) may have completed in 5 waves.
Ethereum Short Term Chart
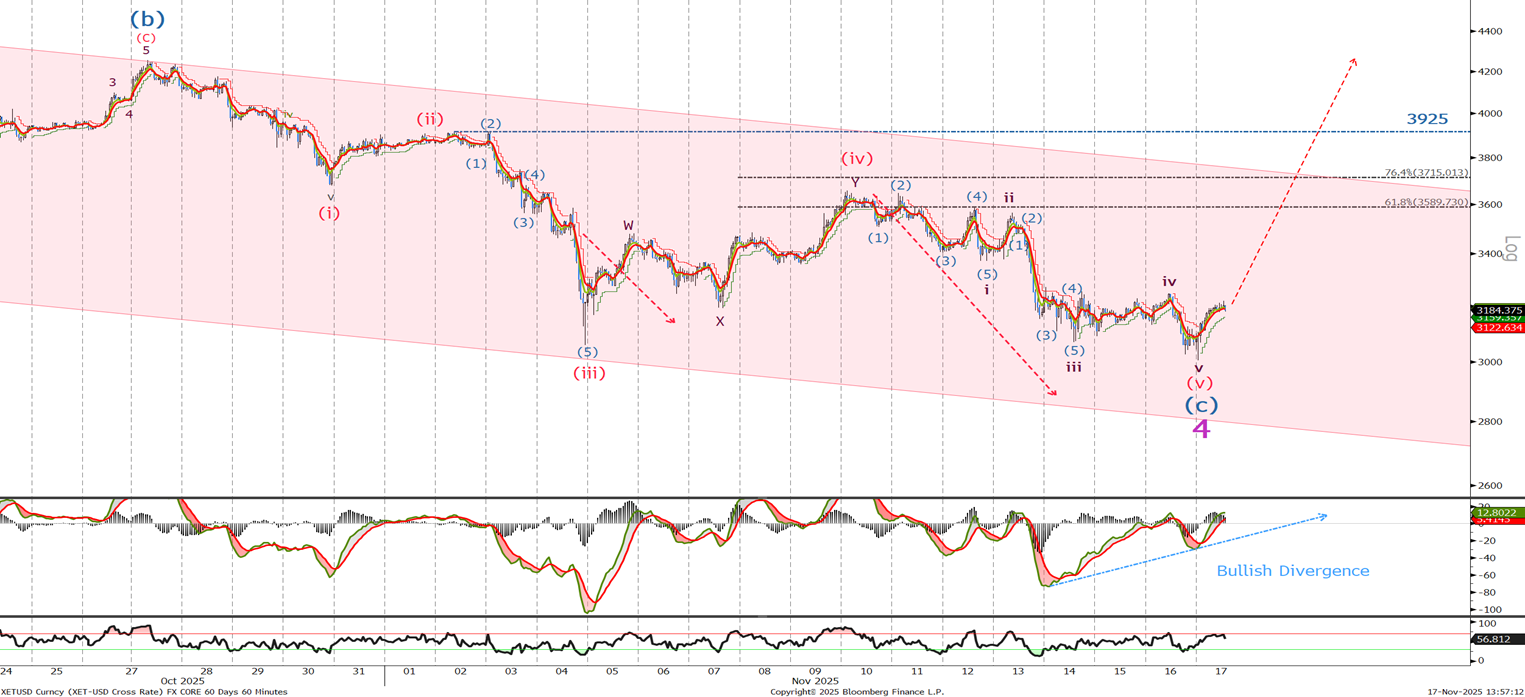
Last time we said ‘Given the wave count I am happy to start selling here and will add to shorts at 3715 with a stop and reverse above 3925 looking for the pushback below 3000 to test the 2922 level before support around the bottom of the channel at 2800.’ We stopped just shy at 3003 and given that I can count a clear 5 waves down plus the bullish divergence in the MACD , I am happy to start buying ETH now at 3180, with a move above 3400 confirming followed by a break of the channel and the wave (iv) high around the 3700 level.