Bitcoin Long Term Chart

As mentioned last week ‘Looking at the daily I believe we are correcting lower in a wave 4. This should see a sell off in 3 waves towards 86-94k level enabling us the opportunity to buy for a final push to much higher levels.’ No change in our long term view with a correction still unfolding. Lets look to see where in the wave 4 correction we are.
Bitcoin Short Term Chart
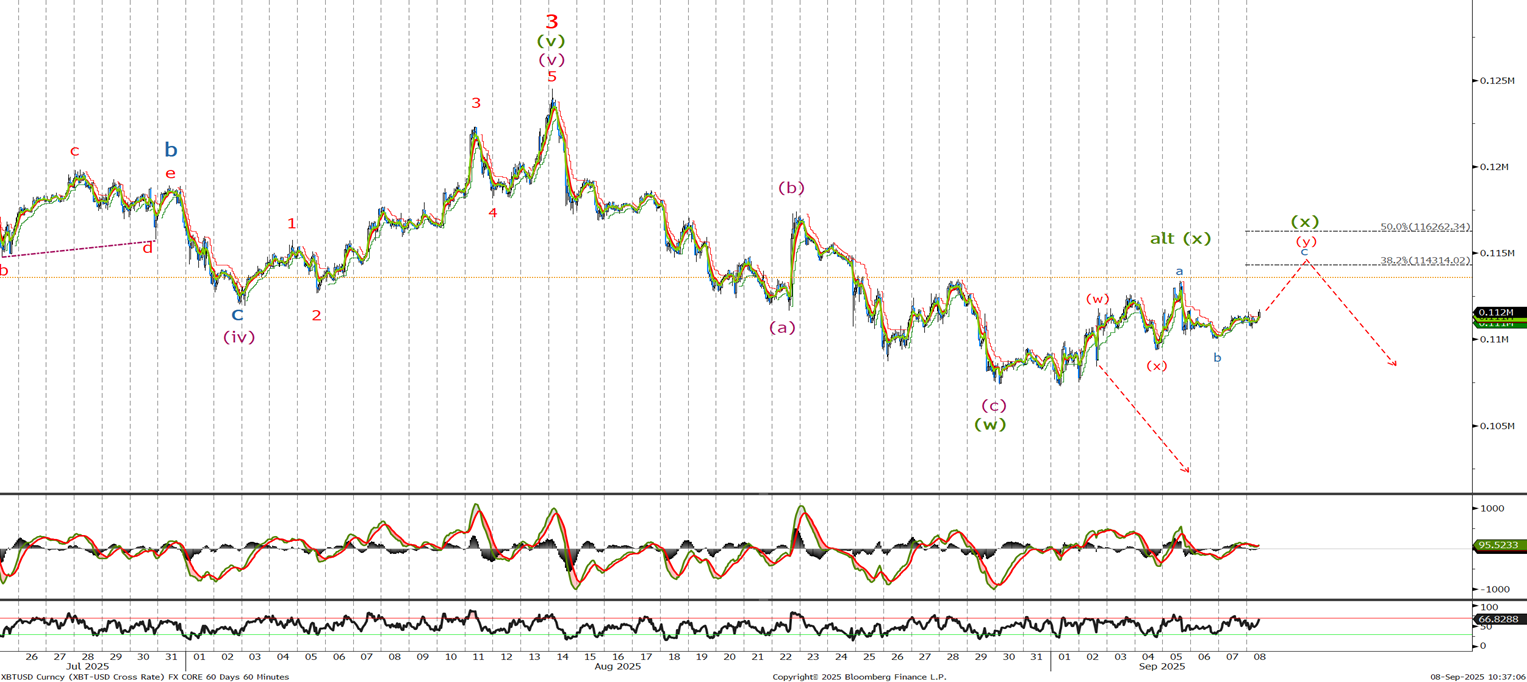
Last time we were selling at market, around 110k level looking for the BTC to trade lower in the correction. It appears that last weeks low was the end of wave (w),it is possible that wave (x) has ended but I am waiting for a push upto 114314 and the 11626 area where I will resell looking for a sell off lower towards the 86-94K area to complete the wave 4 correction.
Ethereum long Term Chart
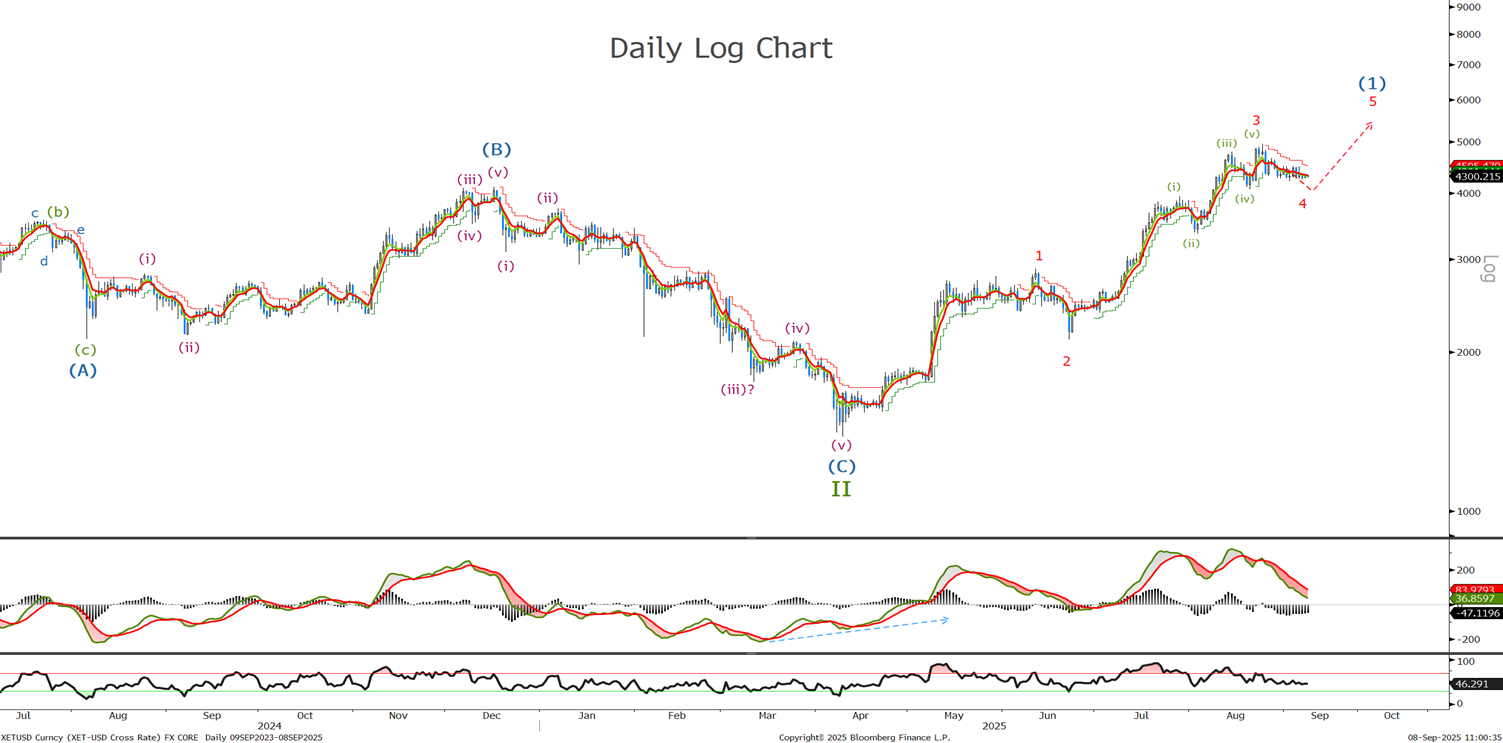
Still no change as we look for lower in the wave 4 correction to end before rallying to new highs. Lets look to see if the correction is close to ending.
Ethereum Short Term Chart
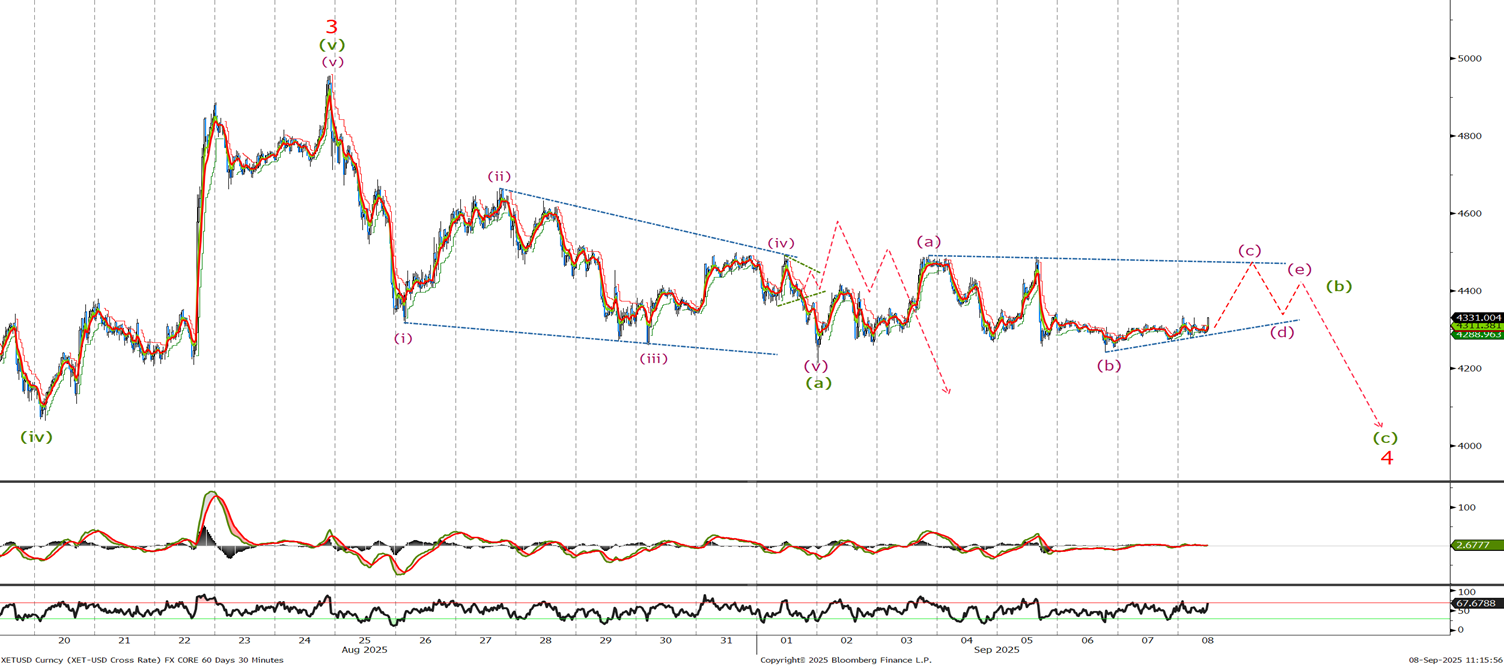
I have changed the count as the ETH continues to trade sideways with a few more days range trading to complete wave (b) of the three wave correction before a sell off towards the 4000-3930 area. Look to sell around the 4400 level now. A move above the wave 3 high and 5k level will confirm the correction is over but at this stage I believe there is more downside to play out. On a break of 4k lower stops to the 4500 level .