Bitcoin Long Term Chart
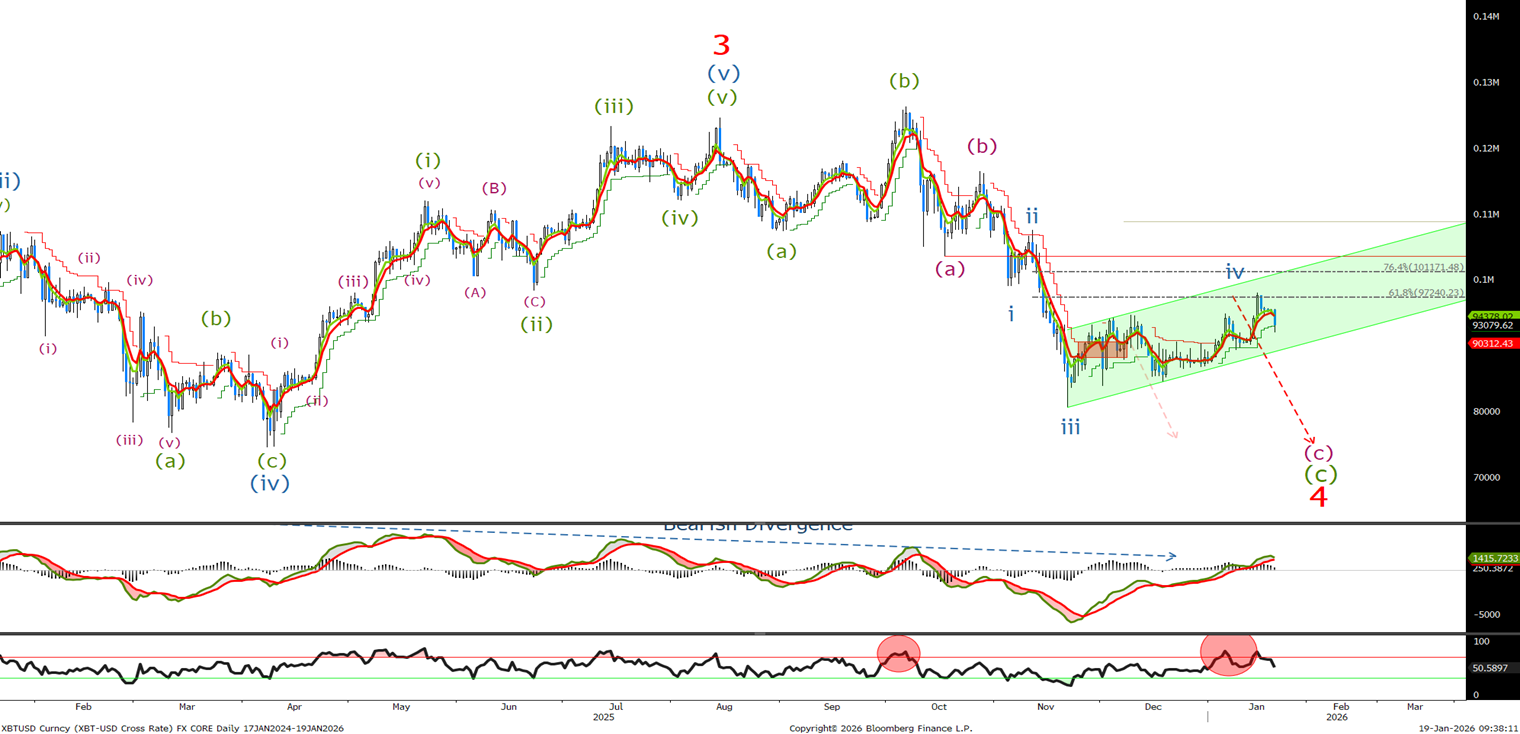
Last time we said ‘Look to sell at the 97K level and I would move my stops up to the wave (a) low at 103.7K. I will remain bearish on the BTC for a push towards the 80K level.’ We traded to the 61.8% retracement level at 97240 and my view remains valid with stops at 103.7k. Look for an acceleration on a break out the channel.
Bitcoin Short Term Chart
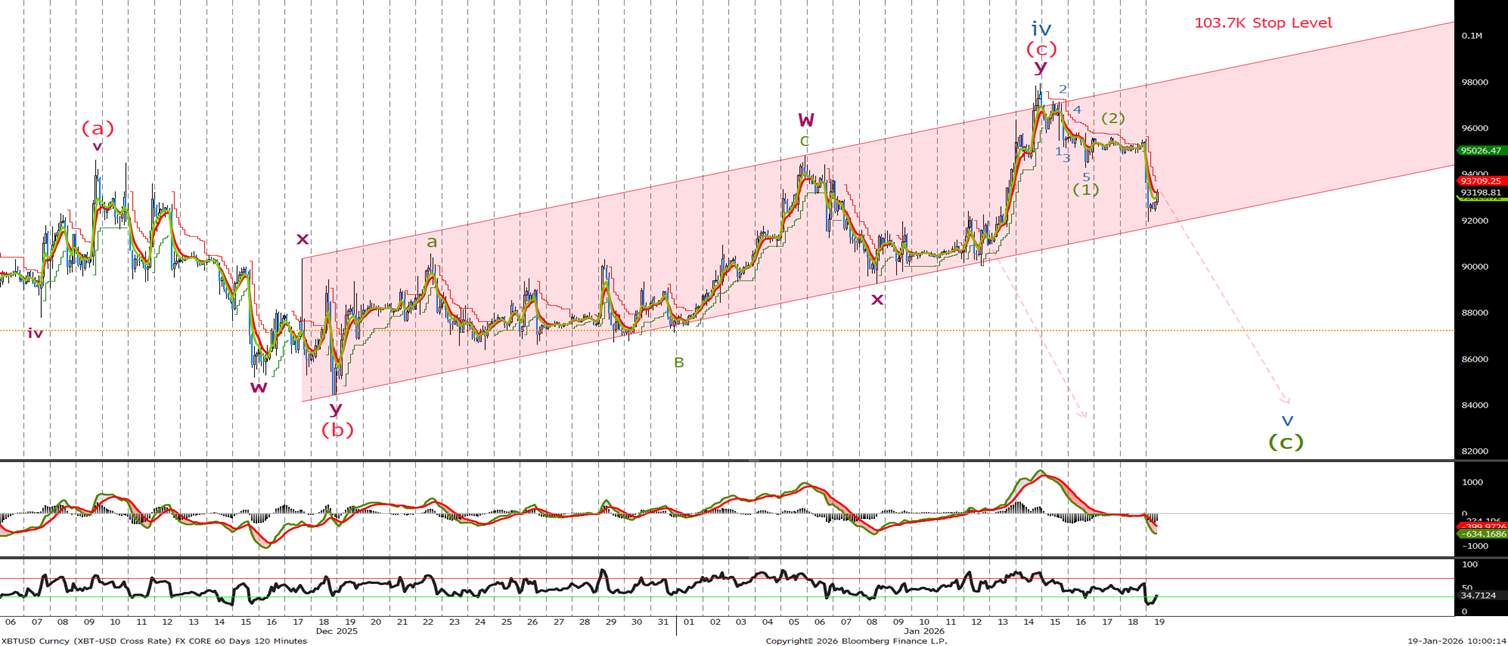
Last time we thought wave iv had ended and we said ‘with wave iv completed at 94785 before selling off. It appears that minor wave ii is complete so sell now at 90460 with stops above the high of wave iv or at the previously mention 103.7K.’ I was wrong on the timing with the BTC trading up to 97922. This should signal the end of wave (iv) and the overnight sell off adds weight to this view. I would stay short with stops above last weeks high or as mentioned in the long term chart 103.7k.
Ethereum Long Term Chart
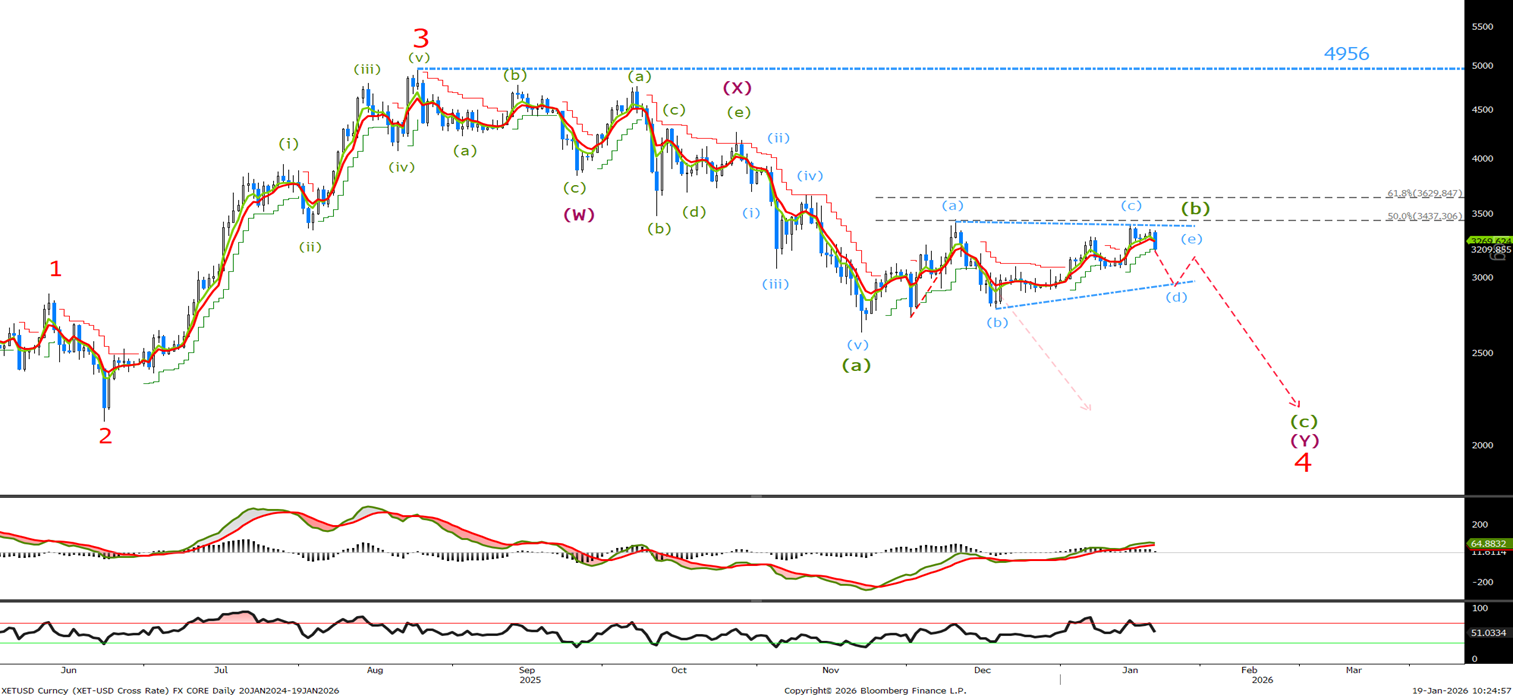
Last time I said, ‘It appears we are tracing out a corrective triangle that should turn from below 3450 with confirmation that wave C is underway on a break below 2774. A move above 3450 will target 3629, and we would sell there with stops remaining at 3827.’ The wave (c) continued higher, stopping at 3403 just below the stop, and today we have sold off sharply. I believe this is the start of wave (d). Let’s see where we are in the short-term chart.
Ethereum Short Term Chart
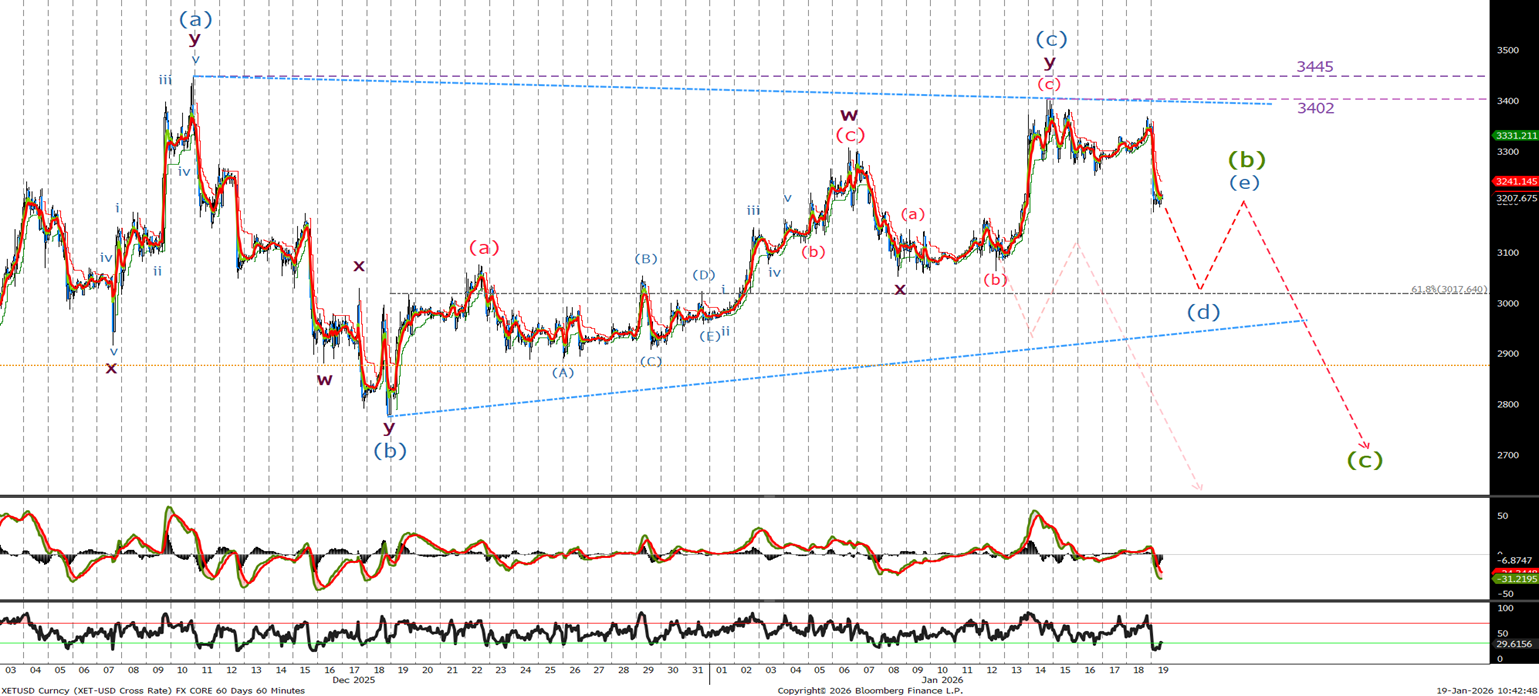
Last time I believed ‘wave (c) had ended, and I am happy to sell here at 3080 with stops at 3310 or 3450.’ We traded at 3402, but I am still happy to be short with stops above 3450. A break there doesn’t negate the bearish view, with the possibility of a normal zigzag and a test of the 3700 level before lower. We will examine that view if it occurs, but I would still sell now at 3220 with stops at 3450.