Bitcoin Long Term Chart
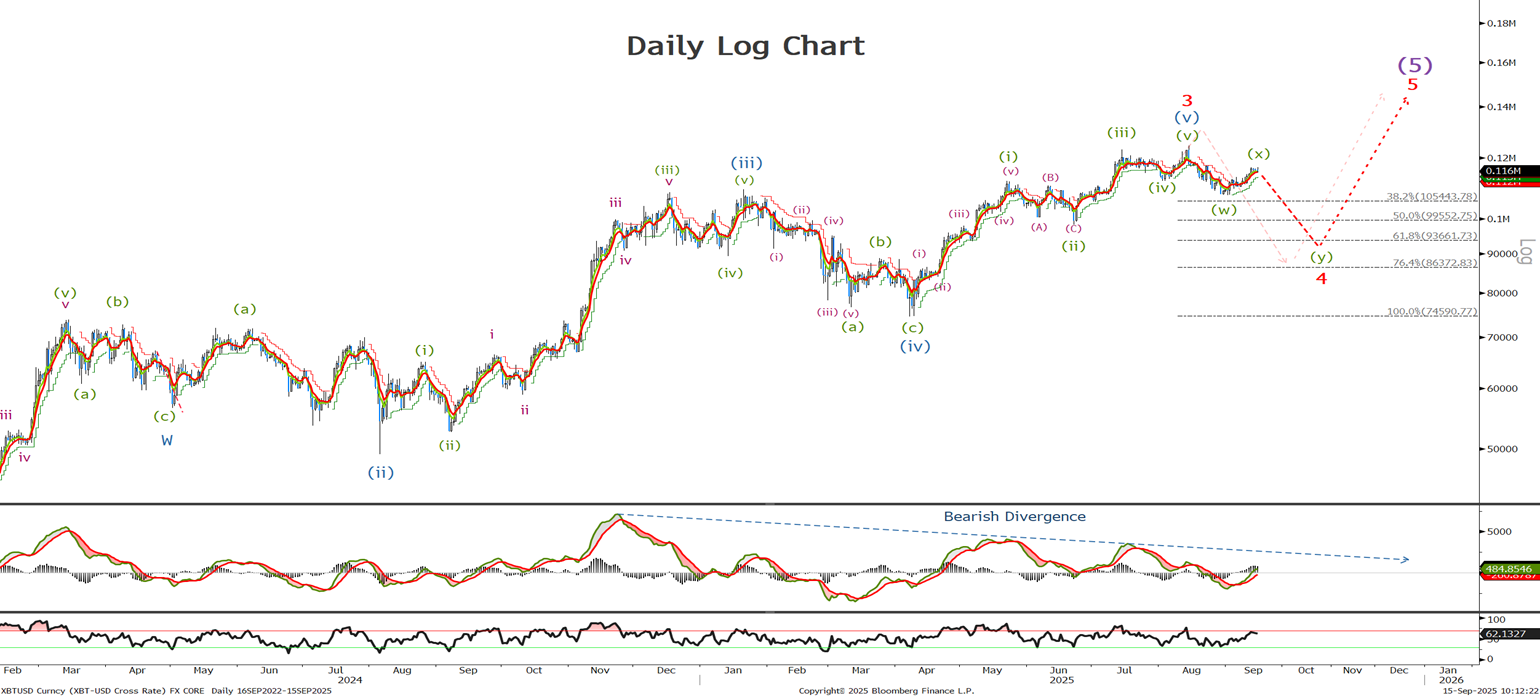
As mentioned last week ‘Looking at the daily I believe we are correcting lower in a wave 4. This should see a sell off in 3 waves towards 86-94k level enabling us the opportunity to buy for a final push to much higher levels.’ No change in our long term view with the second of the 3 waves close to completing. Lets look to see where in the wave 4 correction we are now.
Bitcoin Short Term Chart
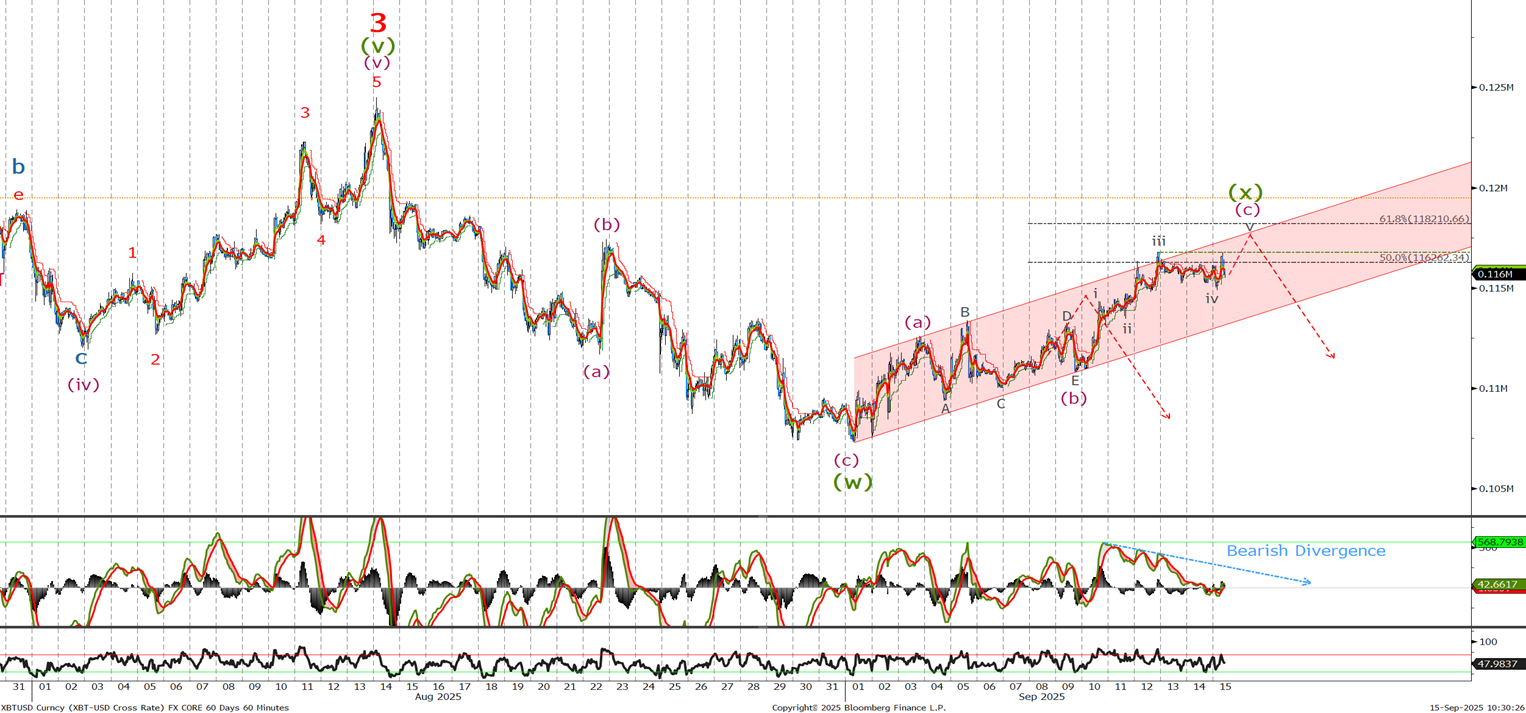
Last time we said ‘It appears that last weeks low was the end of wave (w), I am waiting for a push upto 114314 and the 116260 area where I will resell looking for a sell off lower towards the 86-94K area to complete the wave 4 correction.’ We traded to 116760 and it appears we should have one new high above that level before the sell off to to the above mentioned levels. If long I would reduce position here and rebuy on dips.
Ethereum Long Term Chart
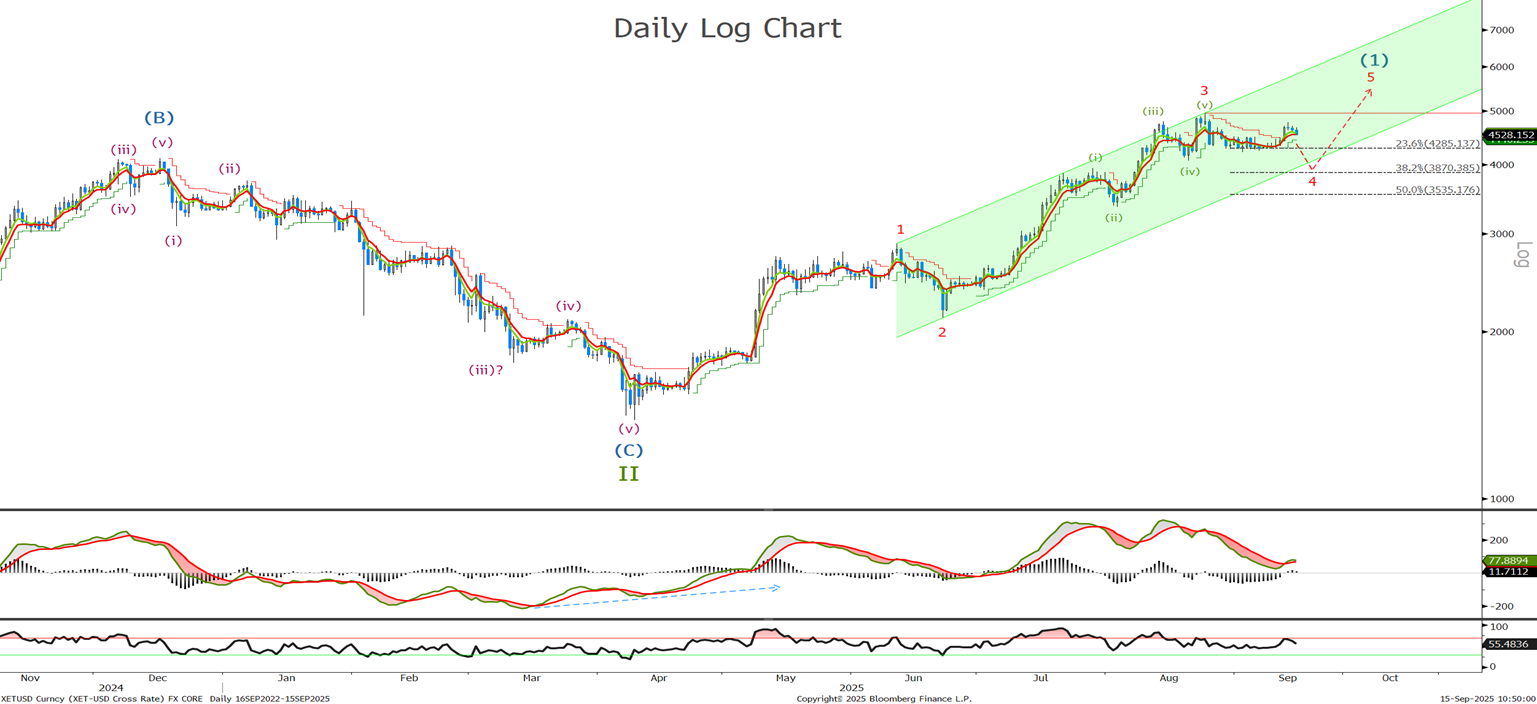
Still no change whilst below 4956 we will continue to look for lower in the wave 4 correction before rallying to new highs. A move above 4956 will indicate wave 5 is already underway. Lets look to the short term chart and see if we can break it down and work out where exactly we are in wave 4.
Ethereum Short Term Chart
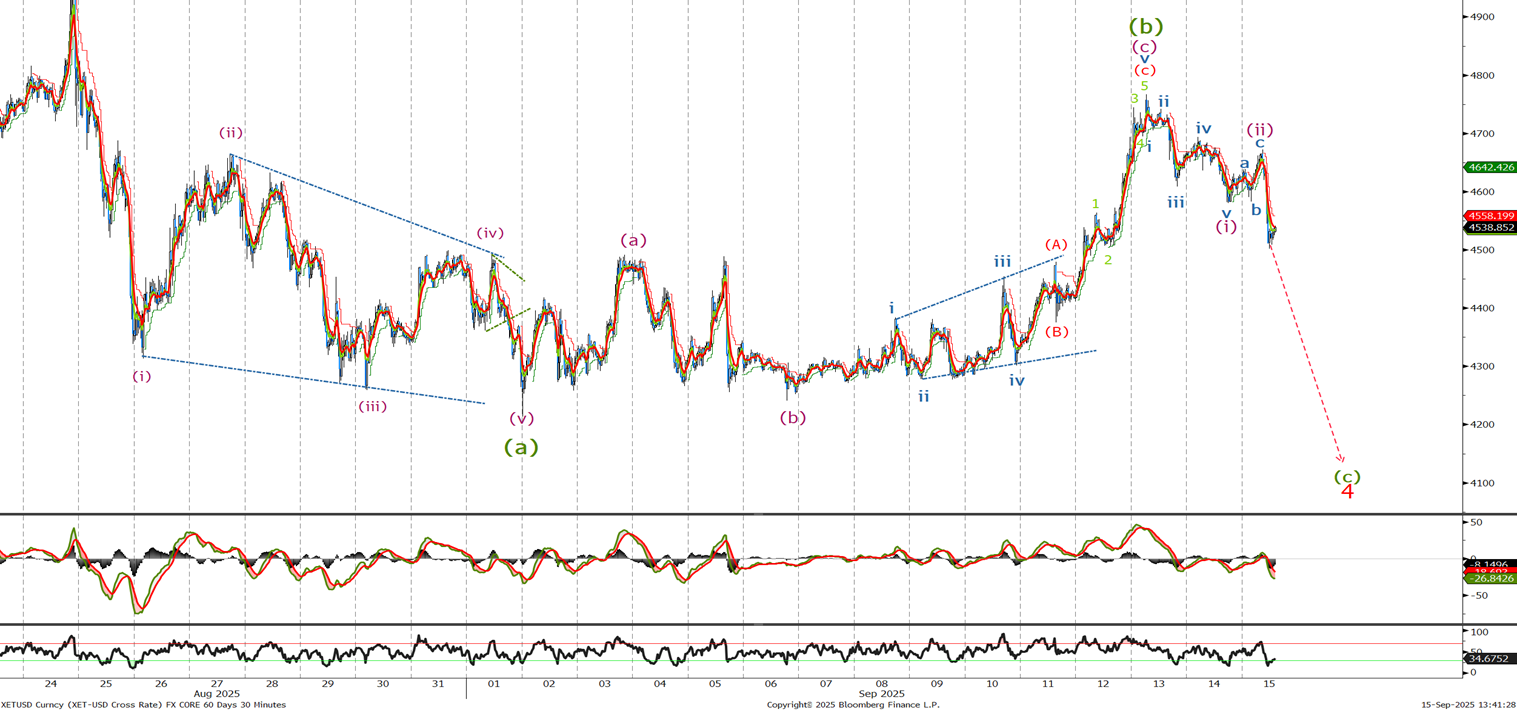
Last time we thought ETH was correcting in a wave (b) triangle however it broke higher and looking at the price action appears to have completed a zigzag for wave (b) of the three wave correction before what we still expect to be a sell off towards the 4000-3930 area. Look to sell now at 4550 with a move above the wave 3 high and 5k level confirming the correction is over, but at this stage I believe there is more downside to play out. On a break of 4k lower stops to the 4500 level and we will monitor the price action for sign that wave 4 has ended .