Bitcoin Long Term Chart
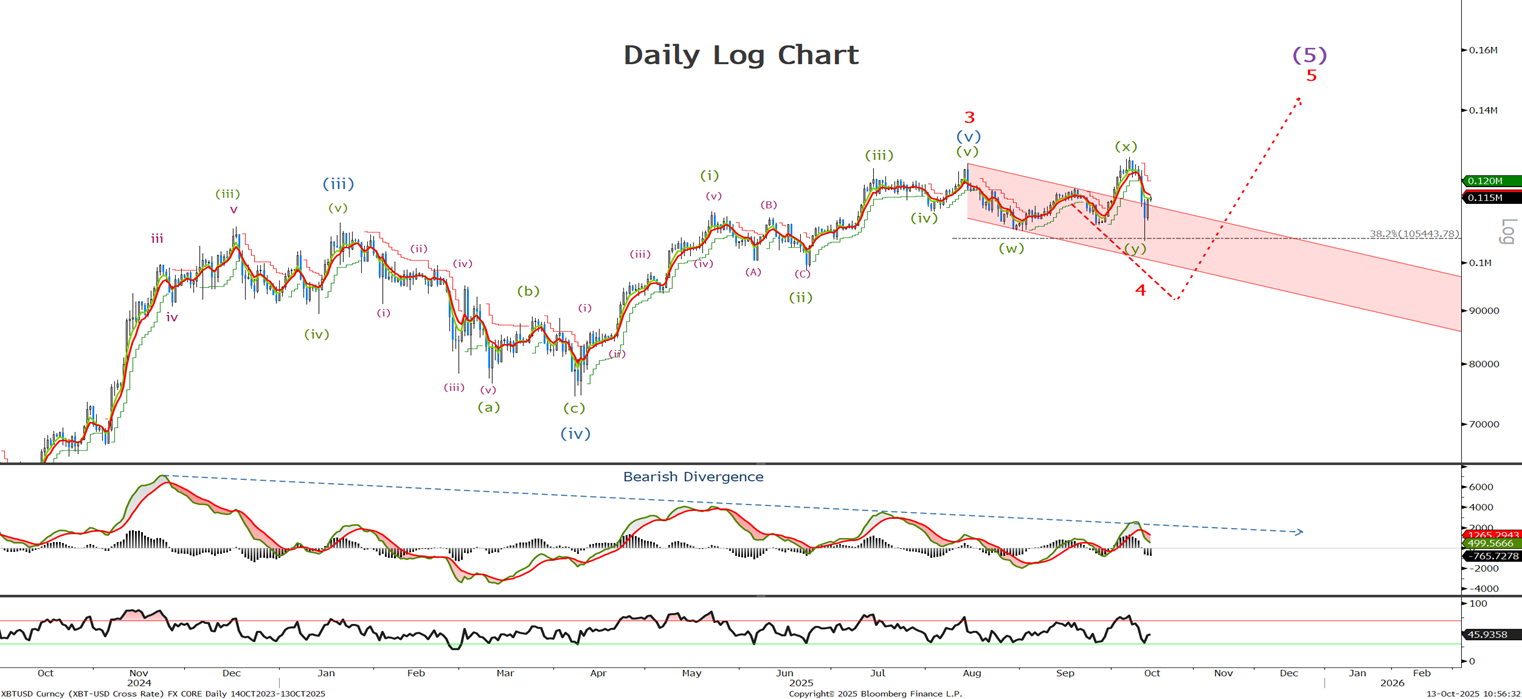
Last time we said that ‘the second of the 3 wave correction lower was underway. If wave (y) is underway we should see a sell off in 5 waves to complete this leg of wave 4 ‘ It was too early to say wave (y) was underway trading up to 126k before selling sharply off last week , testing the 38.2% retracement at 105444 before reversing to complete the wave 4 correction. Look for wave 5 to new highs unfold over the coming weeks
Bitcoin Short Term Chart
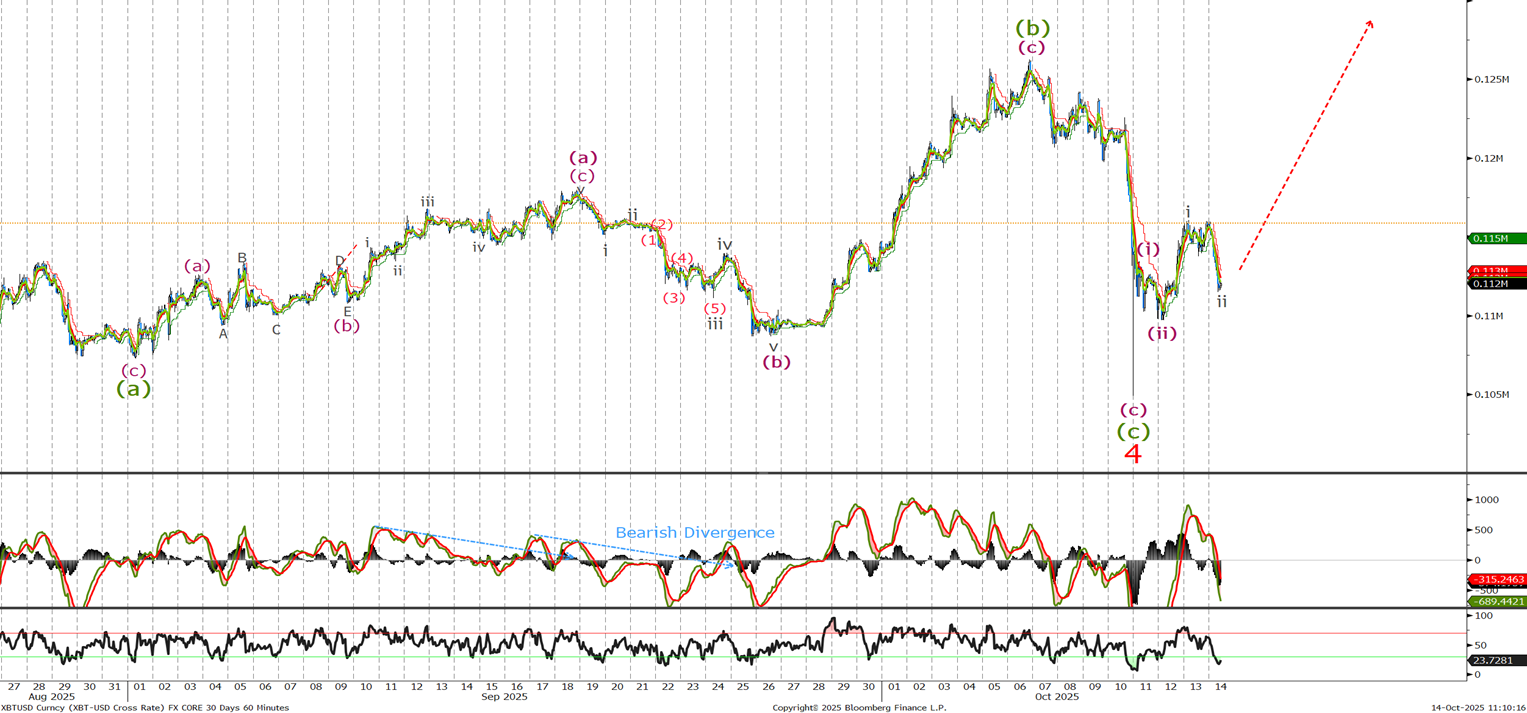
We were not expecting to see the correction trade so high before selling off sharply. Given the steepness of the sell off and subsequent bounce I have relabelled the chart to call the recent low the end of wave 4. Whilst above last weeks 105K low we will continue to look for the BTC to trade higher in 5 waves. I am buying now at 111800 with the next leg higher expected to push above last weeks highs with stops below the wave 4 low.
Ethereum Long Term Chart
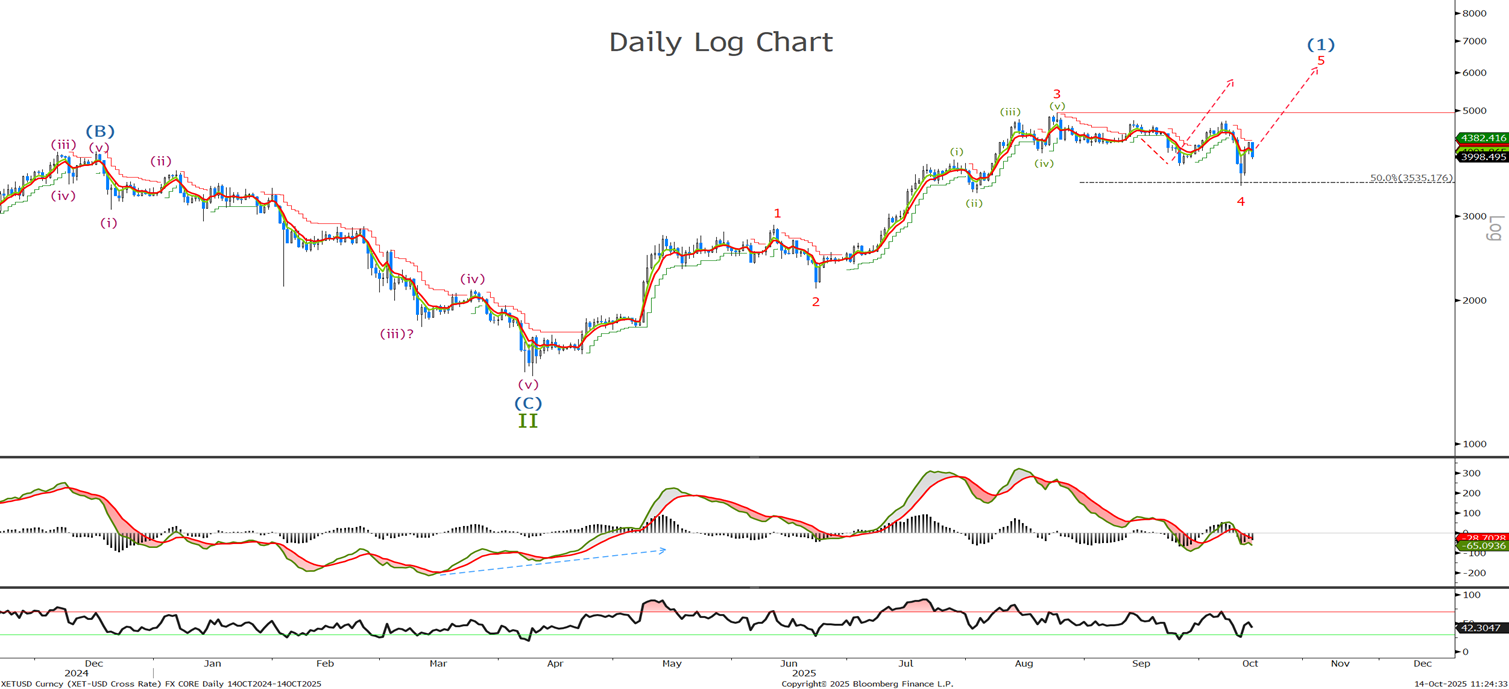
Last time we said ‘The sell off we were looking for appears to be underway to complete the last leg lower of the wave 4 correction.’ The correction dropped to just below the 50% retracement level , further than expectations ,but has since bounced over 15% .So like BTC I am calling the end of the correction and looking for a push to new highs in the coming weeks.
Ethereum Short Term Chart
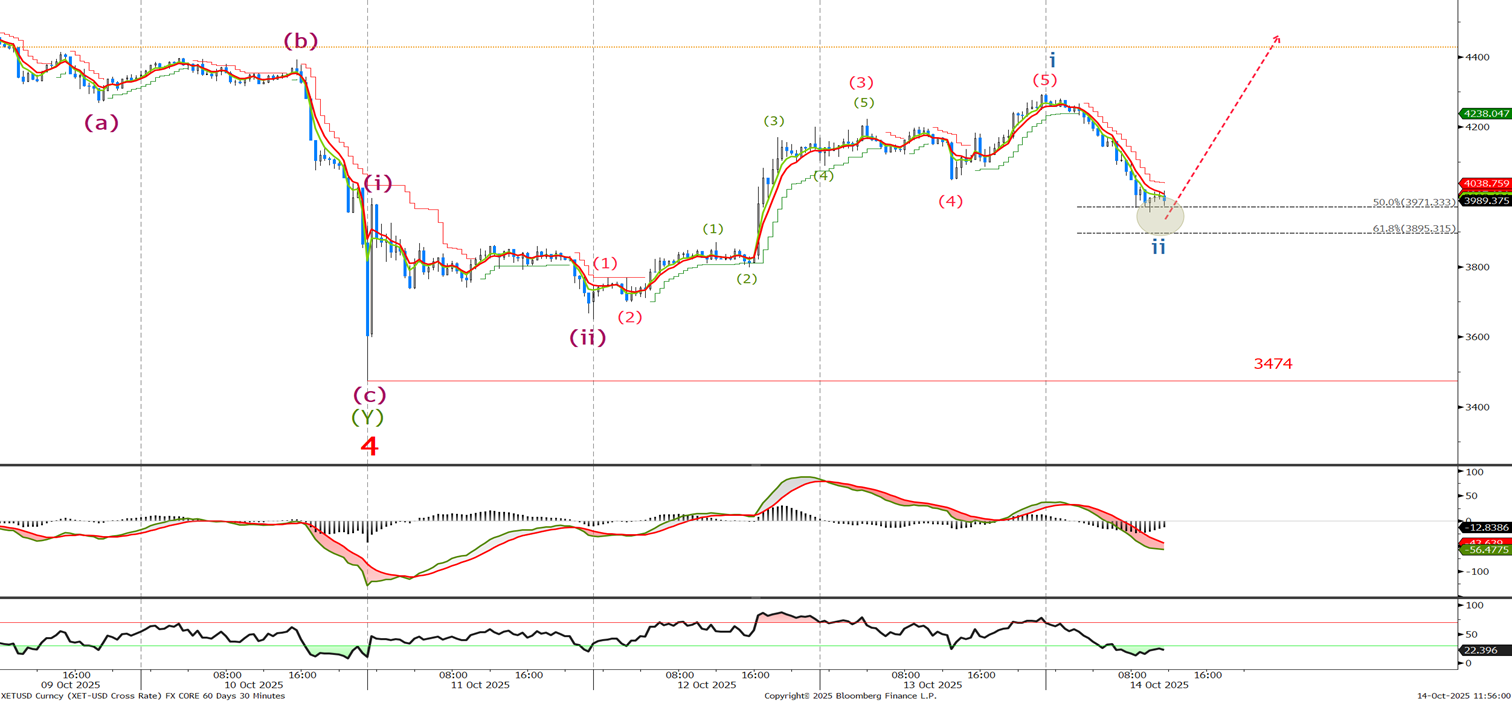
Last time we said ‘Lower stops now to 4650 level now as I continue to look for a test of the 4000 level to complete wave (iii). This does mean there is still a few more days of downside pressure with targets around the 3870 and 3550 and I will rebuild longs down there or a break now above 4650.’ We traded down to 3474 before bouncing to 4293 , we are retracing in a minor wave ii now so I am buying here at 4000 and will place stops below last weeks low.