Bitcoin Long Term Chart
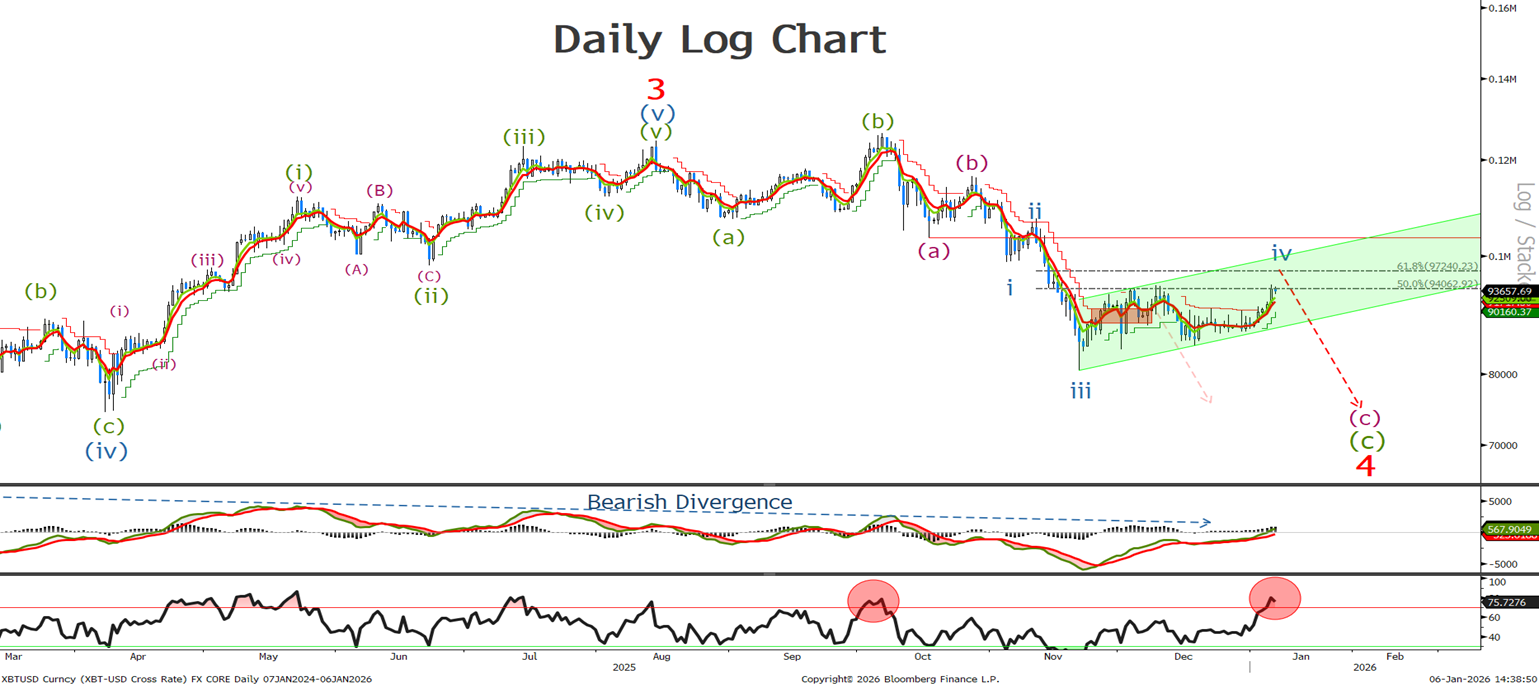
Back from vacation and the first update in almost 1 month and it seems that not much has changed.Last time we said ‘whilst below 99k we will look for BTC to trade lower below the 80k level. Add to shorts at 97.2K with stops at 99k or 107k for a long-term trade.’I would continue to look to sell at the 97K level and I would move my stops up to the wave (a) low at 103.7K , Until that breaks I look for lower and considering the lack of acceleration to the topside over the last 6 weeks and looking at the overbought on the RSI , the red circles. I will remain bearish on the BTC for a push towards the 80K level.
Bitcoin Short Term Chart
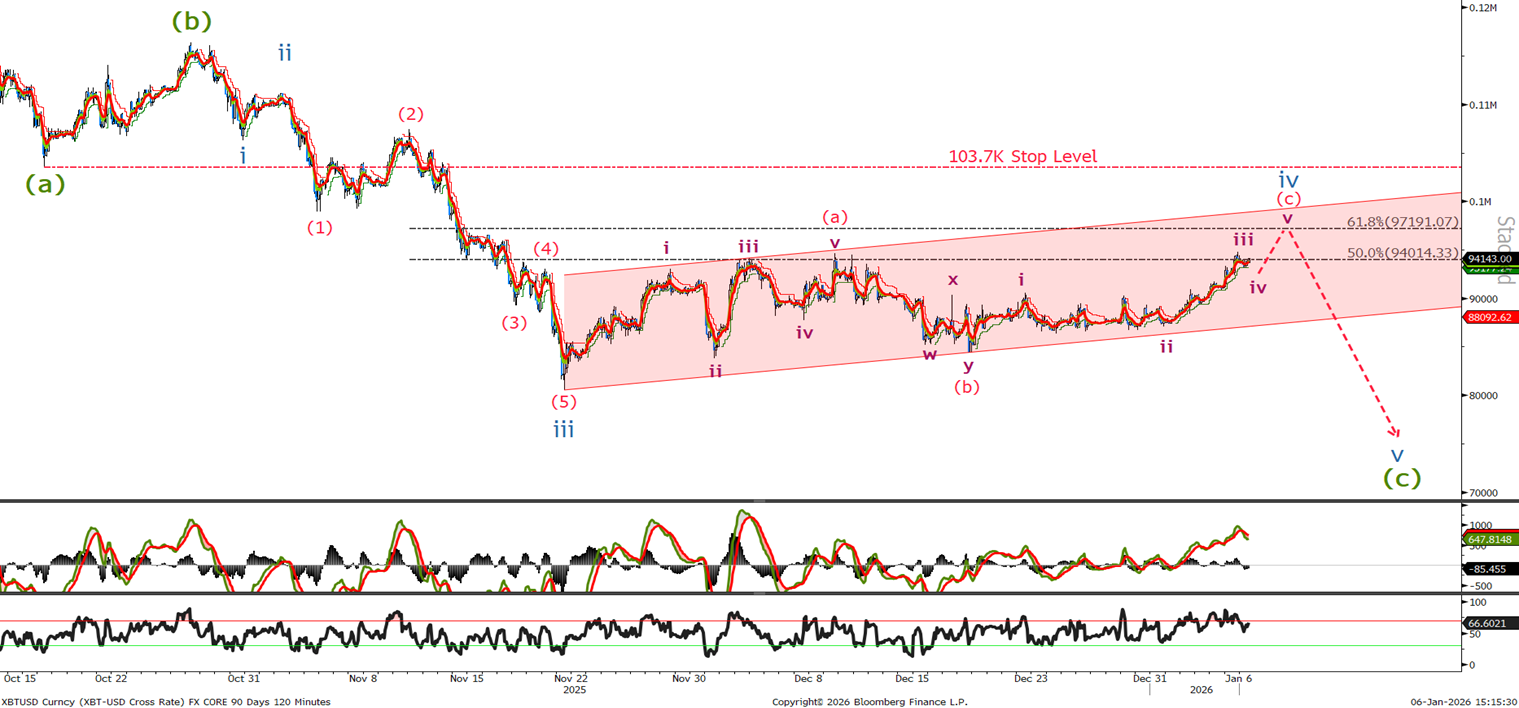
Last time we thought wave iv had finished and said ’I will remain bearish whilst below the 99k level , looking for an acceleration on a break below the 84k level. Towards the bottom of the channel with targets towards the 64k level.’ The correction has been on going but we remain bearish whilst below the now, 103.7K stop loss level. I think we see a short term push towards the top of the channel before the sell off to at least below 80K.