Bitcoin Long Term Chart
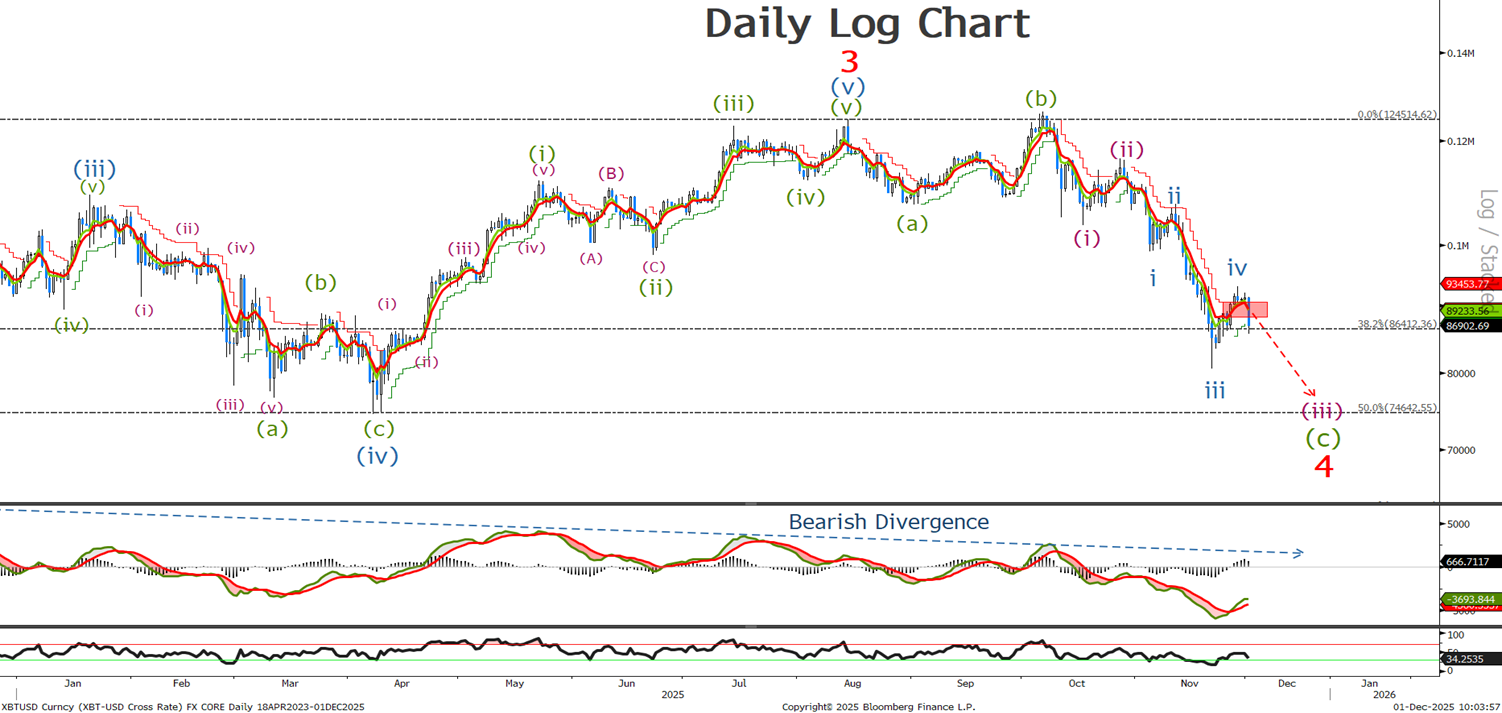
Last time we said ‘It looks to me that we have further on the downside to go to complete wave (iii), lets look at the short term to see if the minor wave iv correction is over before the next sell off.’ We traded up to 93050 just above the red area highlighted and this mornings sharp sell off looks to confirm that wave v of (iii) for a new low below 80550 is underway , lets look at the hourly.
Bitcoin Short Term Chart
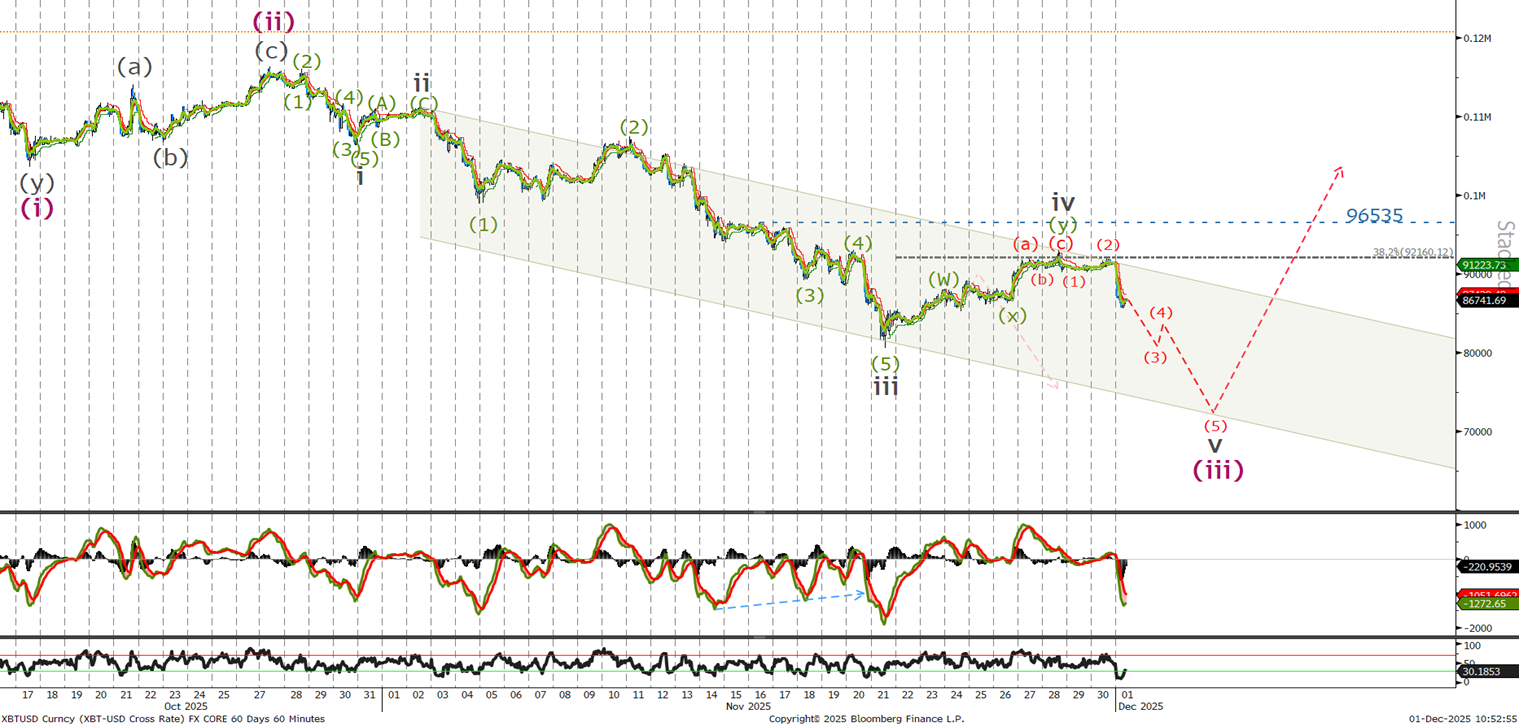
Last time we said ‘It looks like minor wave iii has ended and I think we should see one more leg higher wave (c) to complete the minor correction around the 90-92.1K level. I would look to sell up there with stops above 99k looking for lower towards the 70k level and the bottom of the channel in the coming weeks.The 61.8% retracement level comes in at 62872.’ We traded to 93050 enabling us to sell and below the 96535 stop level. Leave stops there and look for a push down towards the 70k initial level.