
GLOBAL STOCK MARKETS
The first quarter of 2026 was defined by a sharp escalation in geopolitical risk that transformed what had been a broadly constructive macro backdrop into one of acute uncertainty. The quarter opened with markets digesting a complex policy landscape: US tariff pressure on Europe, ongoing negotiations around NATO burden-sharing and the contested status of Greenland, and geopolitical jockeying between US and China over technological supremacy.
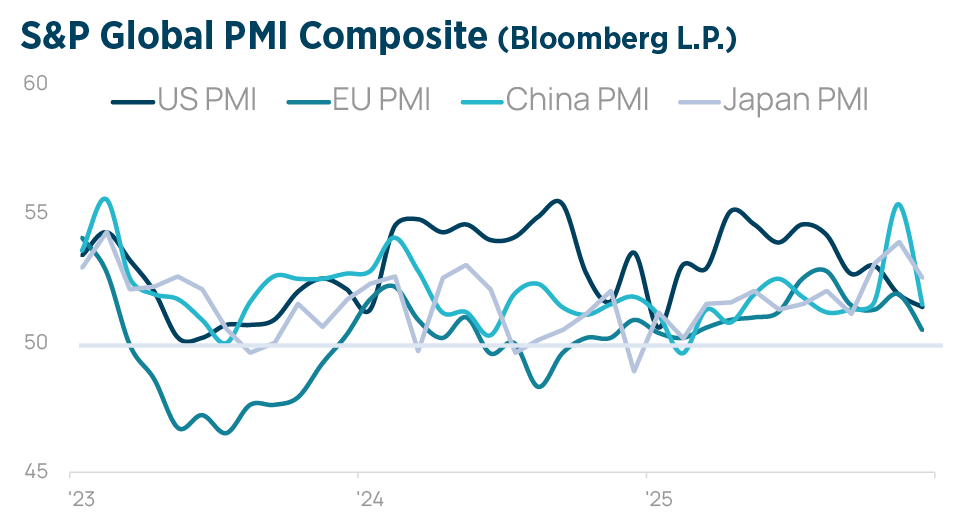
 Underlying economic fundamentals remained supportive, as US GDP growth was seen tracking near 2%, supported by fiscal stimulus and continued AI-related capital expenditure. European growth also showed promise, with Germany’s fiscal expansion beginning to gain traction.
However, the dominant event of the quarter was the US and Israeli coordinated airstrikes on Iran on 28 February, triggering a rapid regional escalation. Iran’s closure of the Strait of Hormuz disrupted roughly 20% of global oil trade, sending Brent crude to as high as $125 per barrel. The IEA described the situation as the most severe global energy and food security challenge in years, with immediate volatility across energy, commodity, and financial markets. Not surprisingly, inflationary pressures re-emerged forcefully, complicating the FED’s already cautious stance on rate cuts, while stagflation risks, higher inflation and lower growth, are now dominating macro forecasts. However, the early weeks of 2026 already brought a cooling of enthusiasm toward the AI spending narrative, with defensive factors, high dividend, low volatility, and quality, outperforming the index’s largest names for the first time in years. A sharp AI-driven selloff struck technology stocks in early February, echoing the DeepSeek shock of January 2025.
 The catalyst this time was a wave of concern that agentic AI tools were advancing rapidly enough to render established software workflows obsolete. The Iran conflict brought an abrupt shift in sentiment in the global investment landscape. The war’s negative fallout is exposing more existing economic vulnerabilities. Some of these have been evident for some time, such as persistent inflation in the US and private credit excesses in advanced economies. Others have emerged more recently, including the Revision of Q4 GDP down to a 0.7% growth rate, from the initial 1.4% estimate.
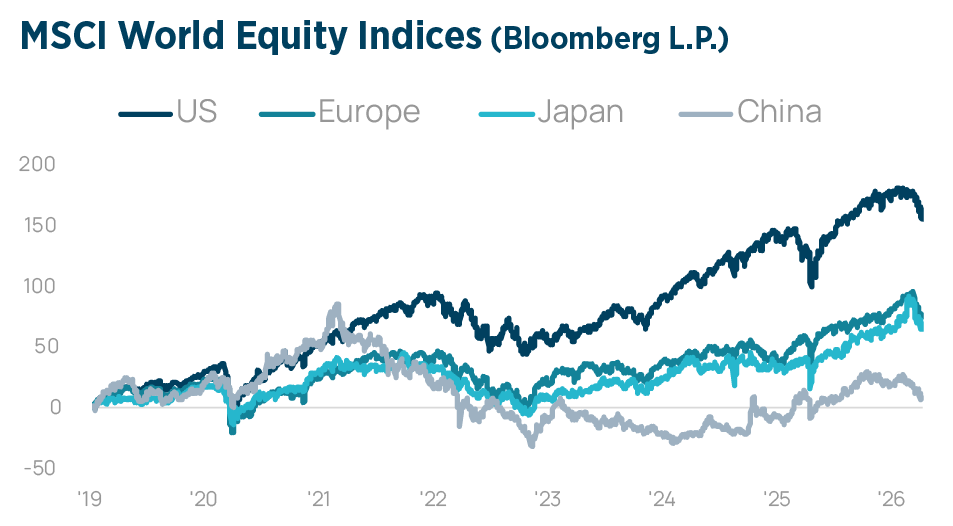
 The sharp slowdown in economic momentum was influenced by the Government Shutdown and weakened consumer spending. The data is showing the growth of the US economy was slowing down well before the US-Israel strikes on Iran. The first quarter underscored the importance of diversification, both geographically and by sector, as single-factor concentration can prove costly in a rapidly shifting risk environment.
GLOBAL FIXED INCOME MARKETS
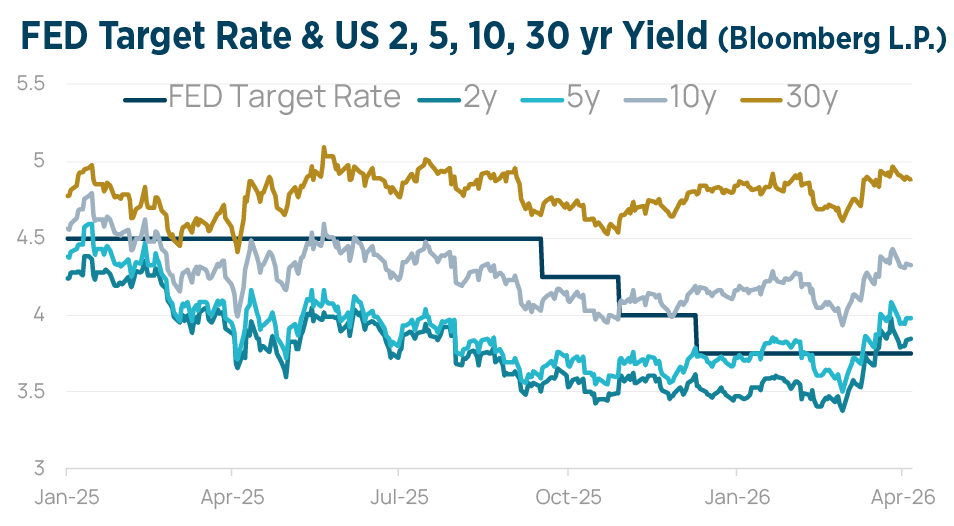
Bond markets entered Q1 in a relatively stable position, with investors anticipating a gradual steepening of the yield curve as central banks eased policy at a measured pace. Consensus had the 10-year US Treasury yield settling in a 3.75%–4.25% range, with the FED expected to deliver two additional cuts.
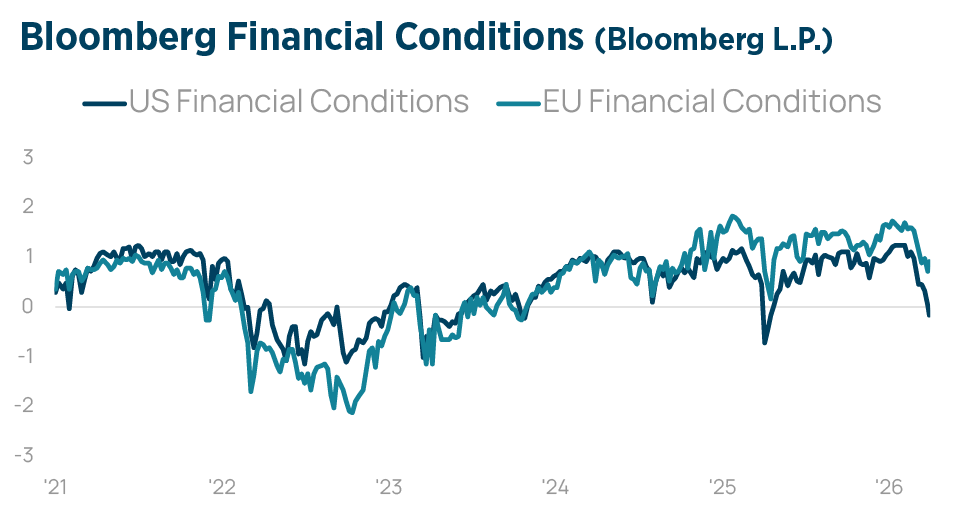
 With credit spreads near the historical tightest levels and limited room to compress further, income was the primary expected return driver. The Iran shock materially disrupted this picture. The energy-driven inflationary impulse placed the FED in a difficult position, caught between rising consumer prices and slowing growth momentum. Military escalation raised the prospect of higher US defence outlays and wider deficits, putting upward pressure on long-term bond yields and unsettling markets that had priced in a benign easing path.
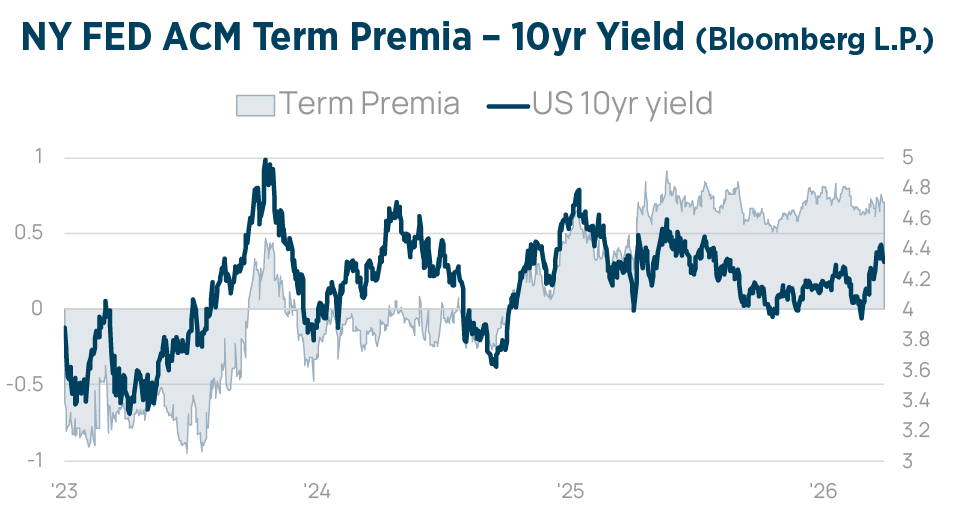
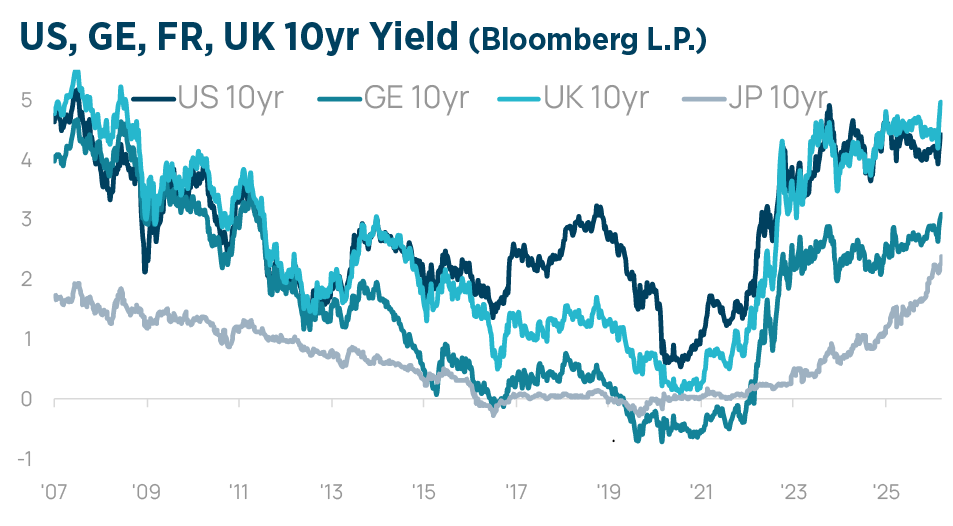
Safe-haven demand provided intermittent support for Treasuries, but the dominant tone in fixed income shifted from income harvesting to defensive repositioning. The surge in inflation expectations drove benchmark yields to notable multi-year highs. The US 10-year Treasury yield climbed to 4.48%, its highest level since August 2025, as markets re-priced the FED’s path and traders began to price in no more cuts by year-end. In Europe, the inflation shock was equally stark: the German 10-year Bund yield broke above 3.1%, reaching levels not seen since May 2011.
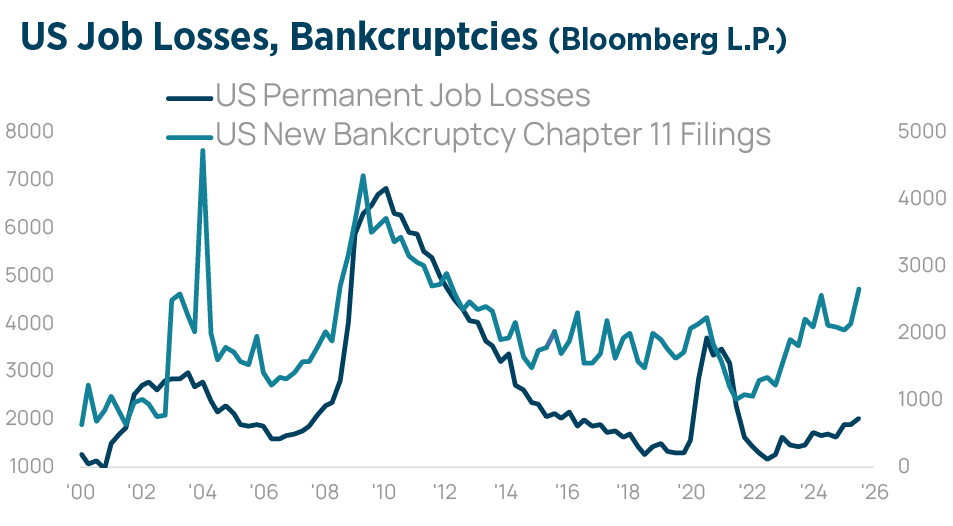
 The ECB, which previously was seen standing pat, was forced to adopt a hawkish pivot, with money markets pricing in at least two hikes in 2026 and possibly a third. Beyond sovereign markets, growing stress in private credit added another layer of unease. After years of rapid expansion, the $3 trillion private credit market faced its most significant test since the 2008 financial crisis. Default intensity continued to rise through Q1, with trailing 12-month borrower default rates climbing to approximately 4% according to Morningstar DBRS, up from 2.8% a year earlier. Concerns over opaque valuations, covenant erosion, and concentrated exposure to AI-disrupted software borrowers further unsettled sentiment.
US DOLLAR
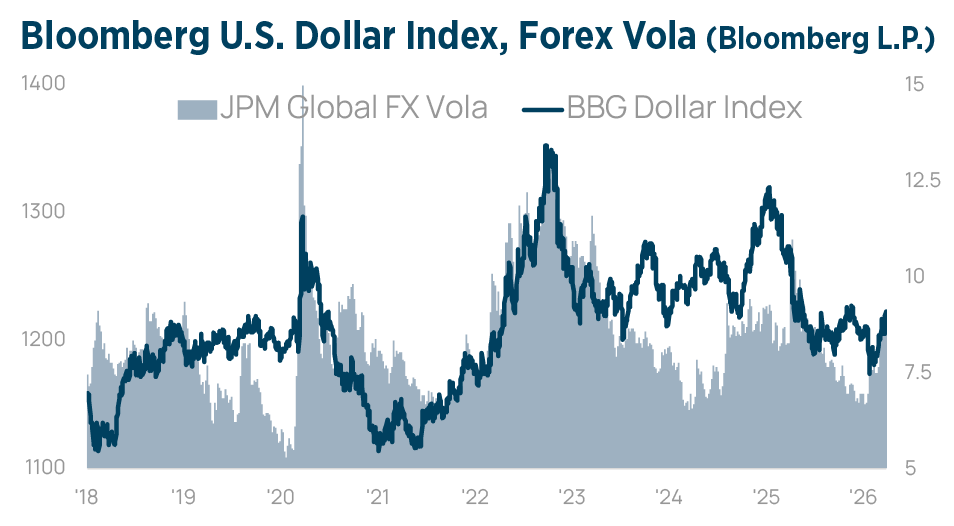
The US Dollar saw a slightly stronger start to the year, but from mid-January onward, negative factors prevailed. The combination of increased expectations of rate cuts by the FED, market uncertainty, and headlines about politics and trade pushed the Dollar below its lows of the previous year. The outbreak of the war then led to an appreciation of the Dollar, as capital flows sought the depth and security of the US financial market. The conflict between the US/Israel and Iran has significantly revived the call for de-dollarization, acting as a catalyst for countries to seek alternatives to the US Dollar-denominated financial system.
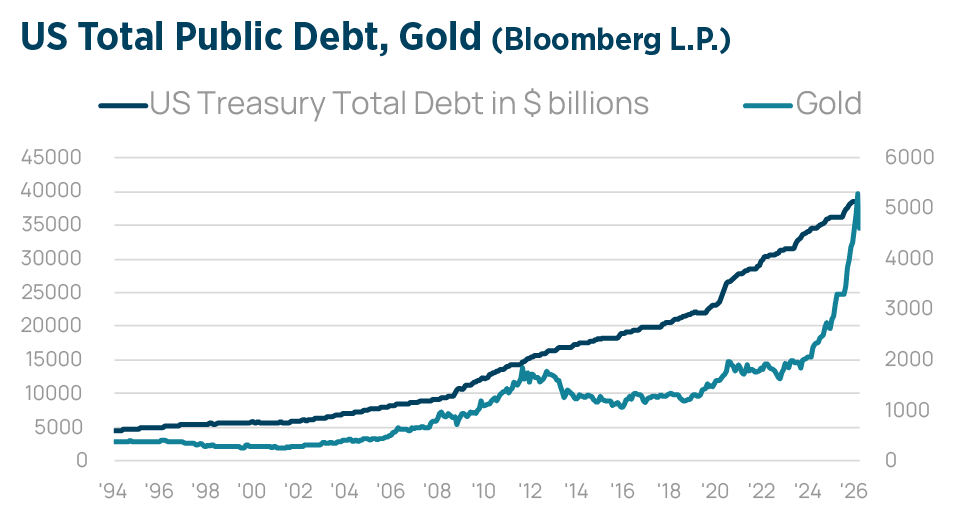
 Although the Dollar’s share of global foreign exchange reserves has declined from over 65% to below 58% over the past 10 years, there is no getting around the US capital market and the dominant role of the Dollar in the global reserve system in the foreseeable future. In the long term, the global financial system will be significantly shaped by the ongoing shift towards a multipolar global monetary system, with the US and China utilizing different strategies to gain influence. The US is increasingly relying on financial technology. The US’ approach focuses on the development of Dollar-pegged stablecoins. China is working on the internationalization of the Yuan and the gradual reduction of its dependence on the Dollar through a dual strategy of Gold accumulation and the promotion its own digital currency. The year 2026 continues to be a very interesting one for the FX markets.
COMMODITIES
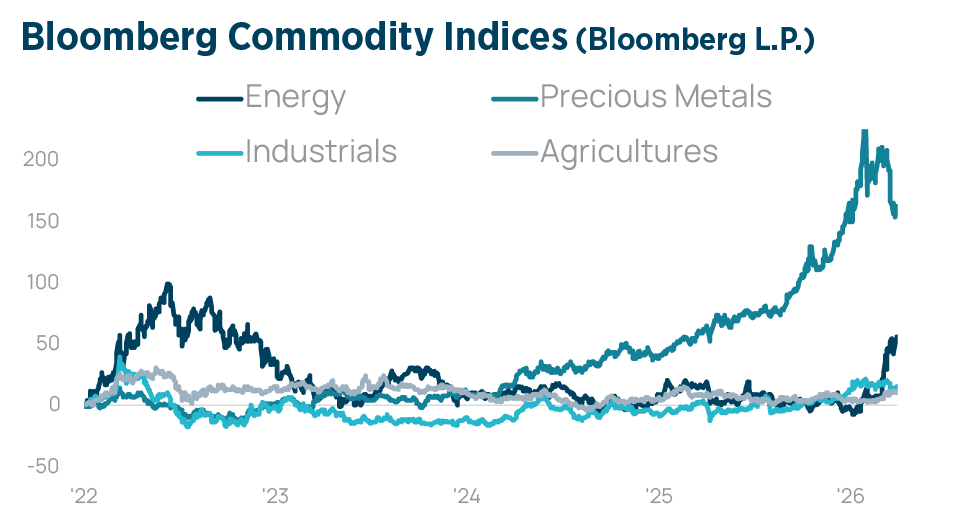
The Bloomberg Commodity Index was up 24% in the first quarter. After an interim gain of 32%, followed by a sharp correction wave, the Precious Metals index still closed the quarter with +8%.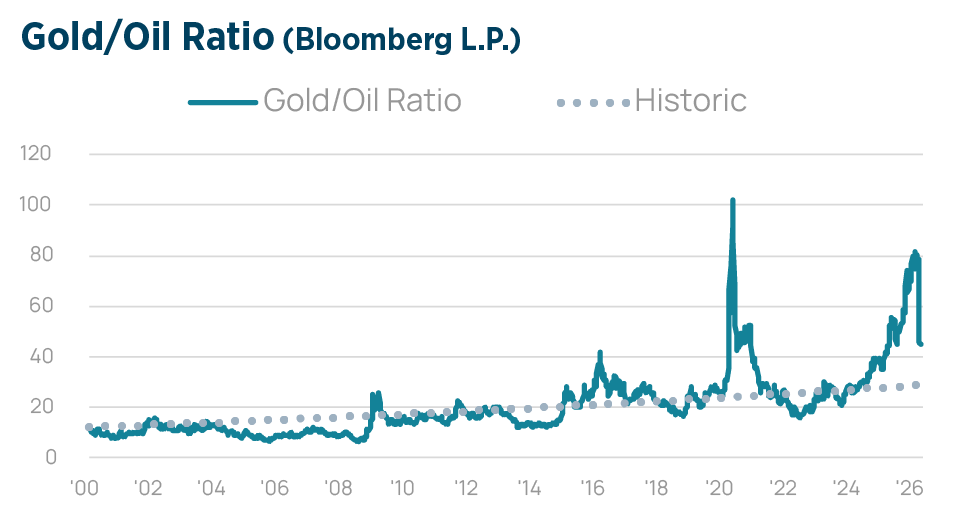
The Agriculture Index also rose by 8%. But of course, it was all about energy, whose index rose by 60%. Although we had warned in our first-quarter report, that the market structure for WTI crude oil pointed to a tight supply following the US intervention in Venezuela, and that speculative positioning had become too pessimistic. The risks had increasingly shifted toward an upward asymmetry.
 Although the geopolitical risks were obvious, the world was caught off guard by the events. At the time of this report’s publication, a 14-day ceasefire was agreed upon. It would be premature to assume a return to normality. There are many questions about the damage caused by this energy shock to global supply chains and its downstream consequences. We keep the recommended tactical allocation in commodities at neutral. We remain strategically positive on precious metals.
MACRO
The 2026 Iran conflict underscored the rising significance of tangible assets in investment portfolios, challenging the dependence on financialized “paper” assets. Unlike stocks and bonds, which can be swayed by market sentiment and inflation, commodities, energy, and infrastructure provide real-world value and serve as effective hedges during geopolitical tensions and inflationary pressures. The crisis exposed structural imbalances resulting from years of underinvestment in energy and threats to critical shipping routes. Oil outperformed Gold at the conflict’s onset, highlighting energy’s role as a more direct hedge against inflation. Meanwhile, sectors associated with the “old economy« such as energy and raw materials, are seeing a resurgence due to supply constraints.
 Risks related to drones targeting critical infrastructure have also heightened the risk premium for energy assets. Sustained increases in energy prices will pressure central banks, which may pose risks to broader markets. Ultimately, the crisis has accelerated a shift in investor focus toward the “real economy,” emphasizing the importance of strategic autonomy, physical production, and resource security in an increasingly unstable global environment. We take no comfort in repeating, that a post-peak globalization world will exhibit stagflationary tendencies. In our last report we highlighted, that the US funding cycle had peaked.
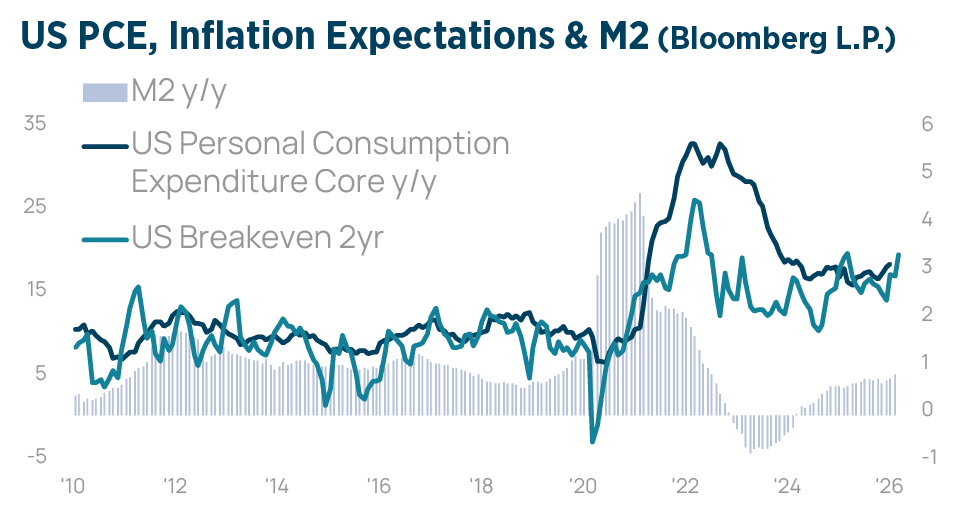
 After a long period of abundant global financial liquidity, that fuelled asset markets, the system has entered a more fragile phase, where liquidity growth is slowing just as a substantial wave of debt refinancing comes due. As a result, there will be renewed periods of volatility that are liquidity-driven, market-centric. Central banks will be required to directly intervene. Global liquidity represents the ease of financing, cross-border capital flows, and the availability of credit. On the other hand, M2 growth has returned to levels of pre-COVID.
 This narrower measure of money, circulating primarily within the US domestic economy, is pointing at a structurally higher inflation regime of around 3-4%. Transcending its regional roots, the conflict involving Iran has triggered a systemic shock, where disruptions in shipping, energy, food, and finance are mutually reinforcing. This trajectory risks accelerating the fracturing of the global order, characterized by rival supply chains and financial systems. This increases the risk that geopolitical instability becomes a permanent driver of volatility and deglobalization.
TACTICAL ALLOCATION
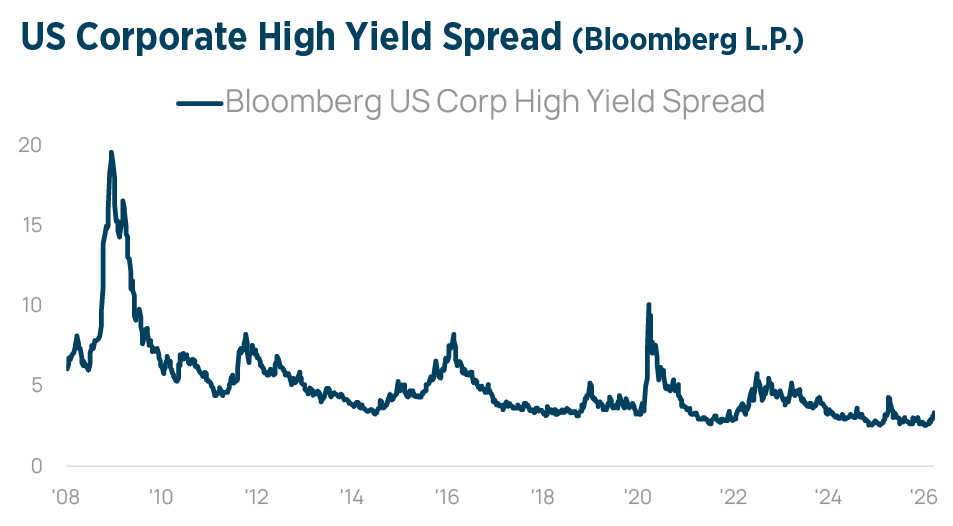 The inflationary forces are structural and secular, on higher debt-load, demographics and on-shoring of manufacturing. We had been in an interim period from 2022-2025 with significant disinflation. As it turns out, unsustainable sovereign debt dynamics and wars can create bidirectional feedback loops. Wars generate more unsustainable debt, while high debt levels can force critical political decisions that spark war. The market currently prices in no more cuts for 2026 in the US, and expects the ECB to hike 2-3x 25bps. Central banks will face a dilemma as inflation expectations are rising, while economic activity faces headwinds. We maintain the allocation in fixed income tactically at underweight. We prefer investment grade. We cut high yield to underweight, as we see credit spreads to continue widening. Private credit concerns remain, however, so far having limited impact on bond markets. Overall, selectivity and diversification are key. Floating rate notes, TIPS and commodity baskets could be used to hedge against higher inflation surprises.
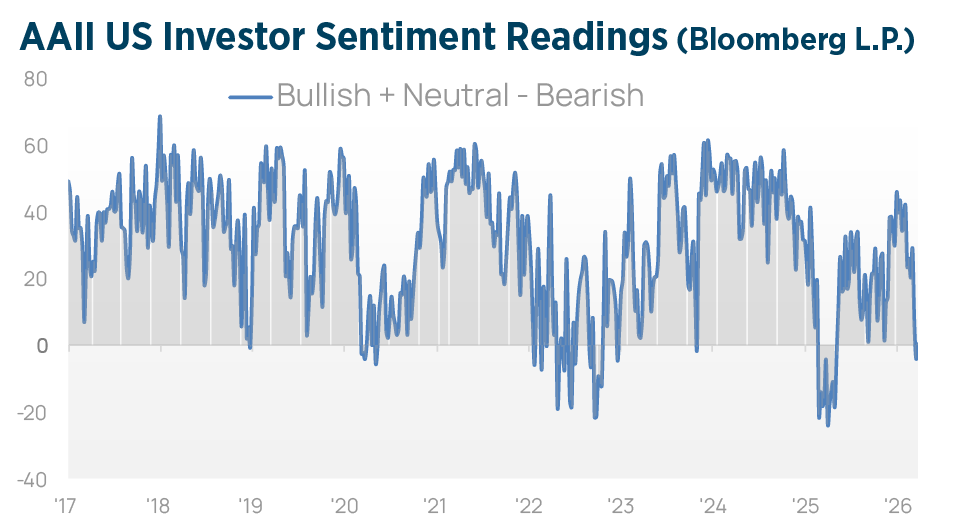
S&P500 & VOLATILITY
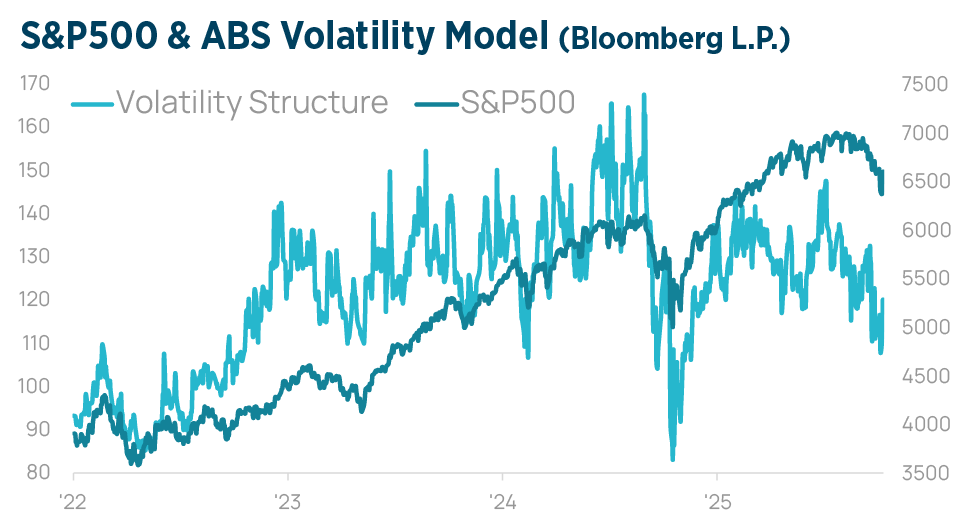
The upswing in the investment cycle has lasted 39 months, if one counts from the low in October 2022, when the liquidity cycle started. We observed in our Q1 report, that market activity had indicated a significant “Great Rotation” was underway, moving capital out of US mega-cap tech stocks into smaller-cap, value-oriented and international equities. The forward 12-month P/E ratio for the S&P500 has normalized from an overvalued 23x, to the 5-year average of 20. Whether this apparent improvement in stock valuations represents a meaningful reassessment of risk is premature. Analysts have not yet factored in the negative impact of higher energy prices on the overall economy. We recommend that investors prepare their portfolio for a more risk-averse market environment. While the recent market correction offers upside potential, the situation has become more complex. We recommend increasing cash levels, reducing emerging markets exposure and favoring US equities over European ones.