Bitcoin Long Term Chart
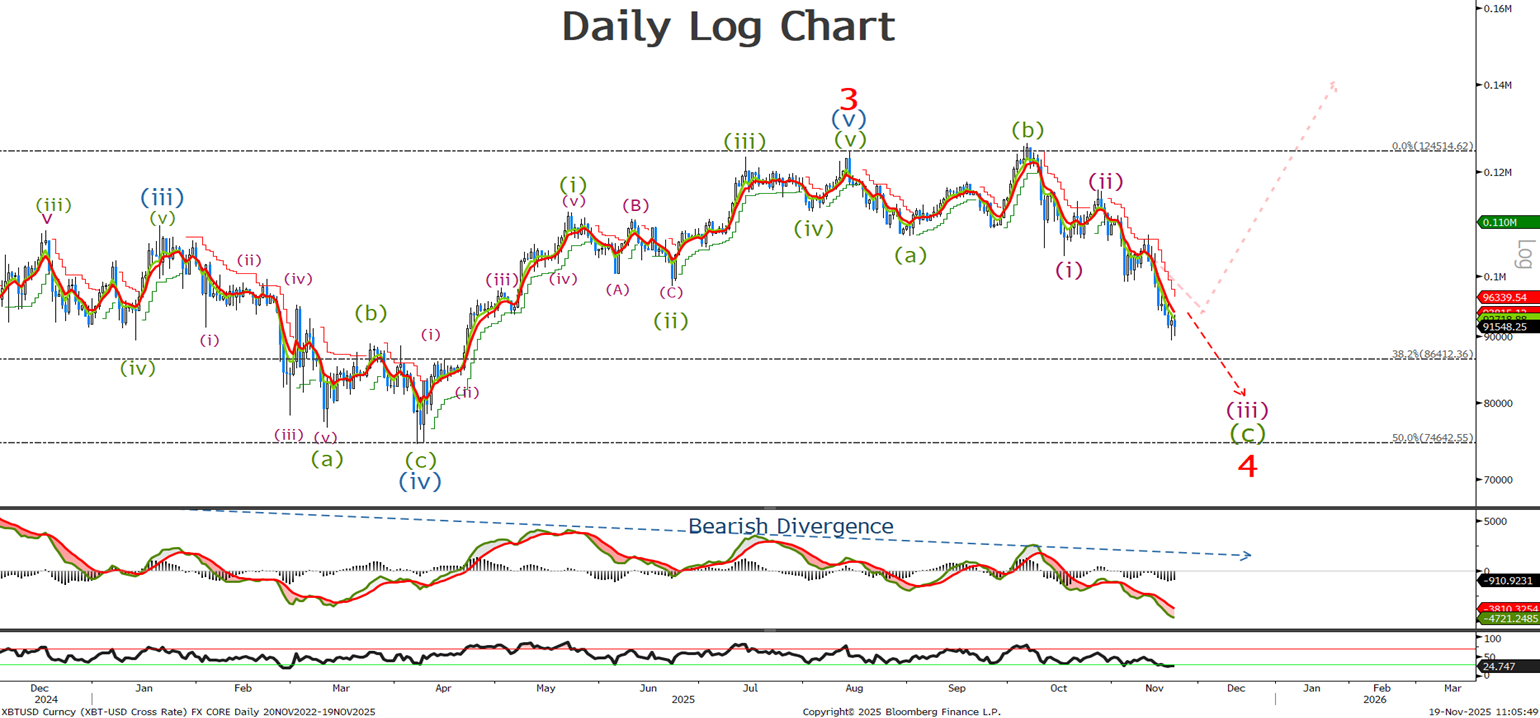
Last time we said ‘I am buying now at 95600 with a move below 88k negating this current count.’ The new count is more bearish with wave (iii) of (v) underway with targets at 86.4K followed by my preferred target around the previous major wave (iv) low and 50% retracement level at 74650, before the wave 4 correction is over and the uptrend resumes to new highs.
Bitcoin Short Term Chart
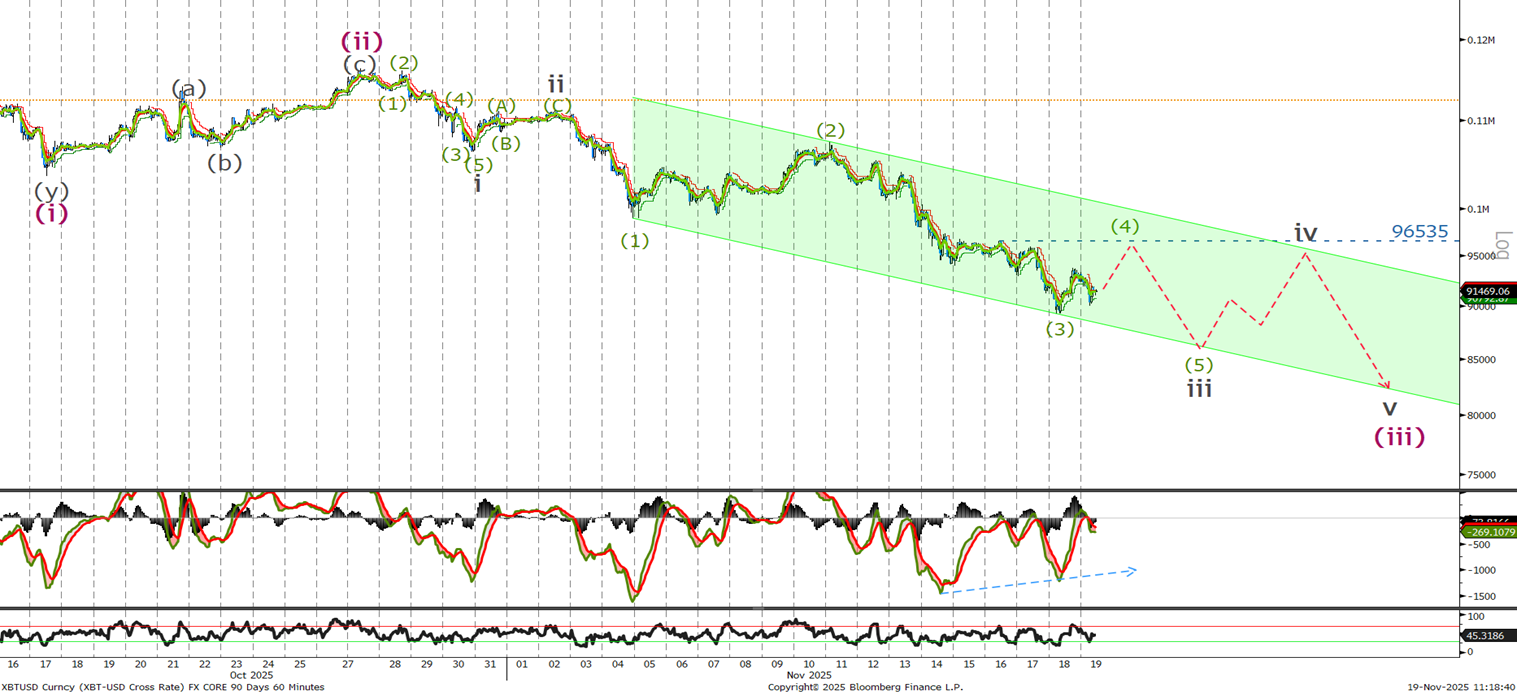
Since the last update we dropped stopping ourselves out at 88k. If we break down this sell off it appears we have several more legs lower , I would use any pull back towards the 92500 level to sell BTC looking to buy lower as discussed on previous charts. A move above 99k would throw this view into doubt but until then I wait to buy BTC at lower levels.