Bitcoin Long Term Chart
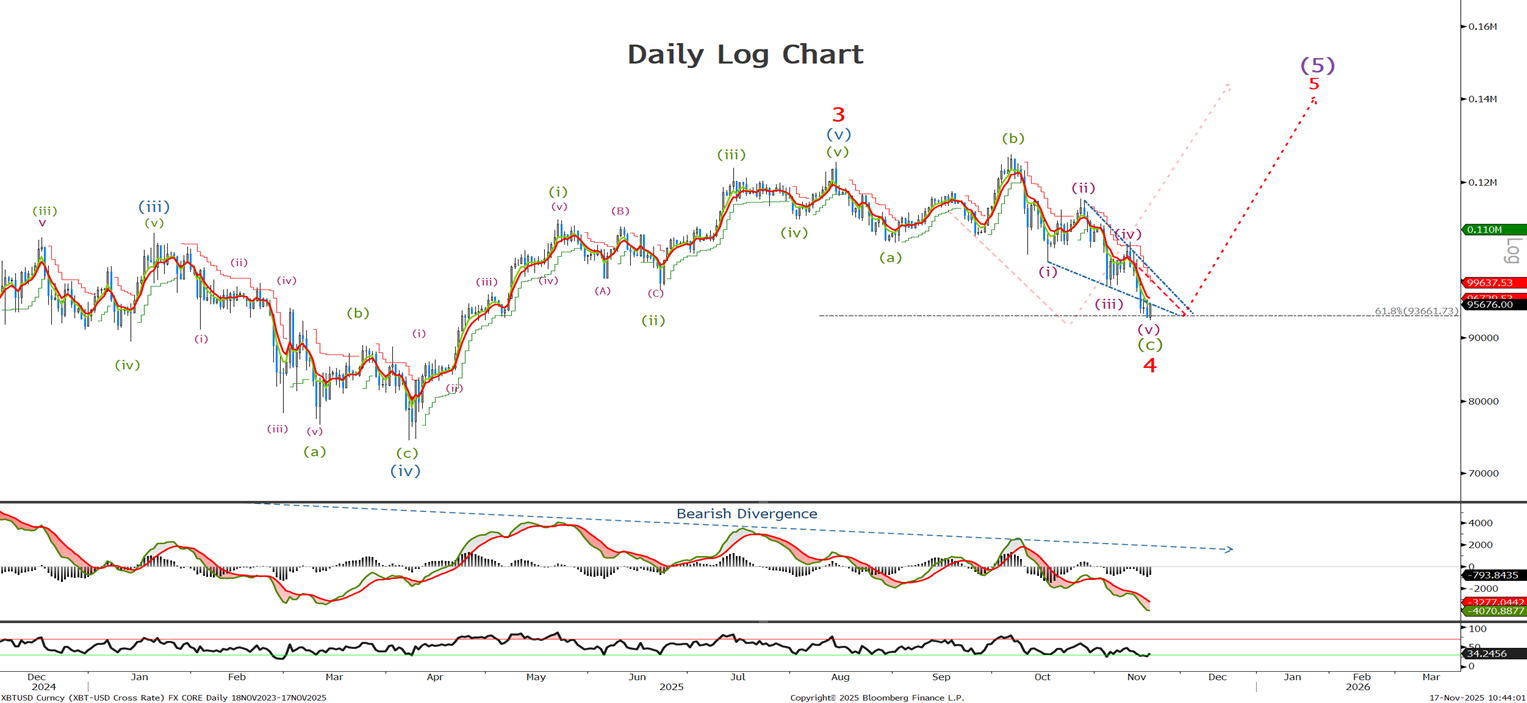
Last time we said, ‘It appears to have traced out 4 of the 5 waves, so I expect to see 1 final push lower.’ I have not touched the above chart other than move the 4 to show a completion of the correction, having traced out 5 waves and finding support at the 61.8% level at 93661. I am buying now at 95600 with a move below 88k negating this current count.
Bitcoin Short Term Chart
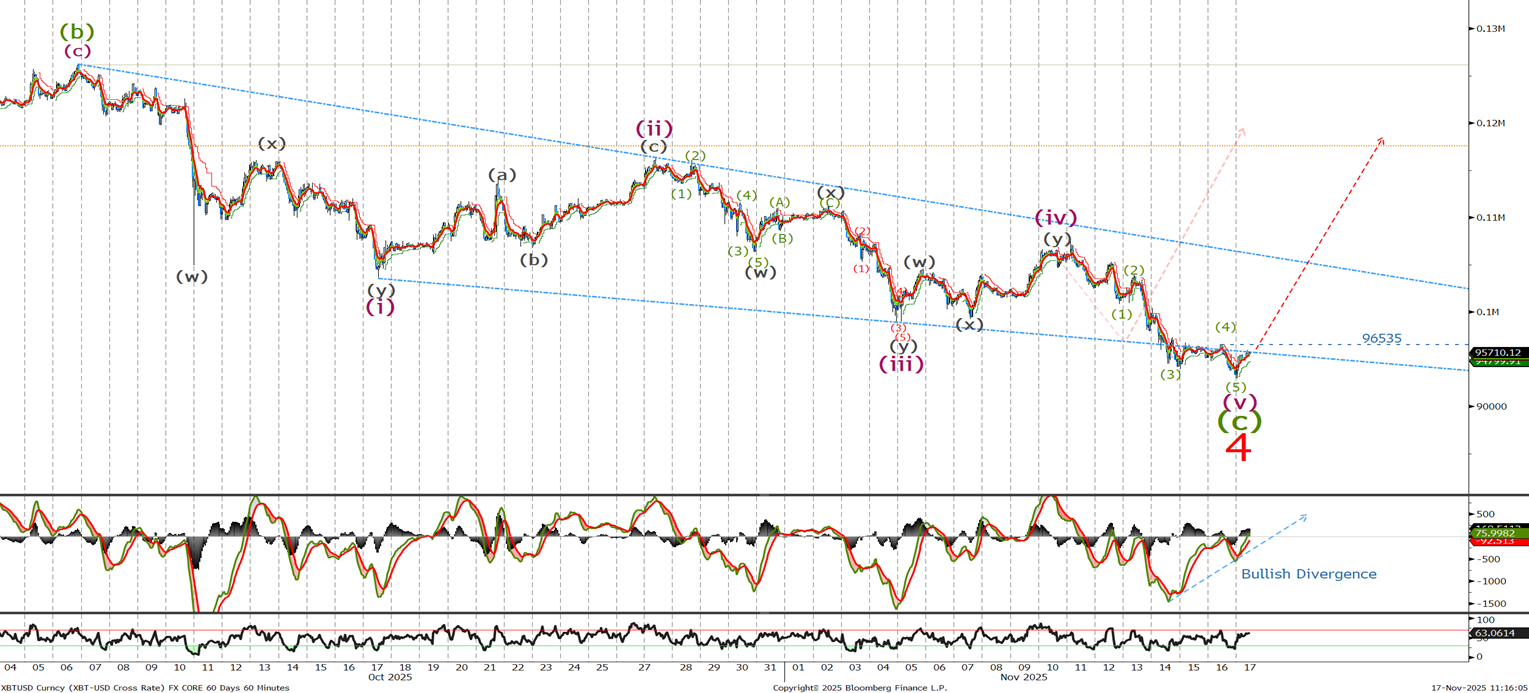
Last time we said ’ It looks to me that wave (iii) of (v) is underway, so a break below last week’s low I believe will see a push past the 99.5 level and I will look to add at the lower 96K level and look to see the price action for signs of a completion.’ We traded to 92935 so we are long and given the breakdown in 5 waves combined with the bearish divergence in the MACD odds favor that a low is in place. An hourly close above 96535 will confirm a low followed by a test and break of the triangle resistance at 105k. If not long, buy now with short term stops, either below last weeks low or the 88k level mentioned previously