Bitcoin Long Term Chart
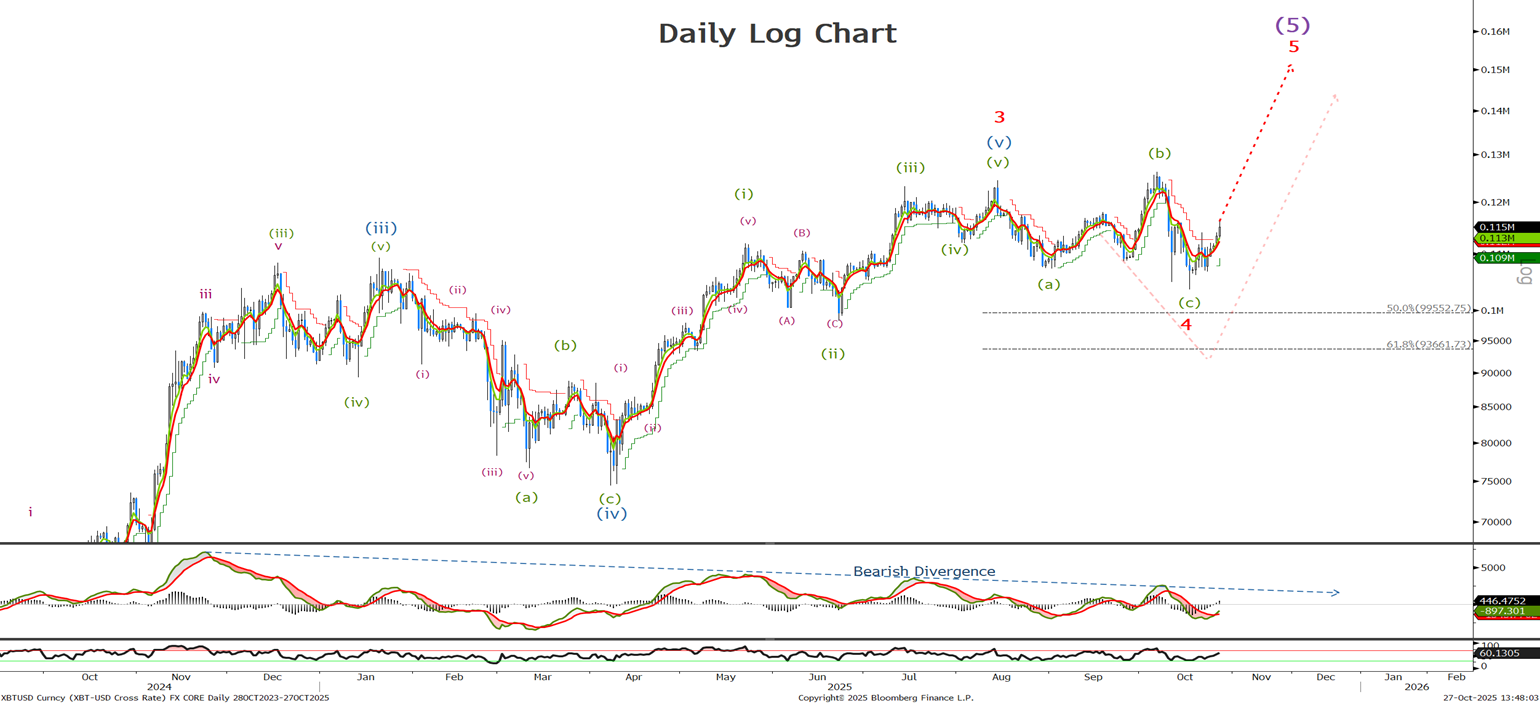
Last time we said ‘having tested the 38.2% retracement at 105444 before reversing to complete the wave 4 correction. Look for wave 5 to new highs to unfold over the coming weeks’ We actually traded off sharply again to just below 103.6K before ending the correction and whilst above this level we will remain bullish in the long term. Lets look to the short term chart to confirm the conclusion of wave 4.
Bitcoin Short Term Chart
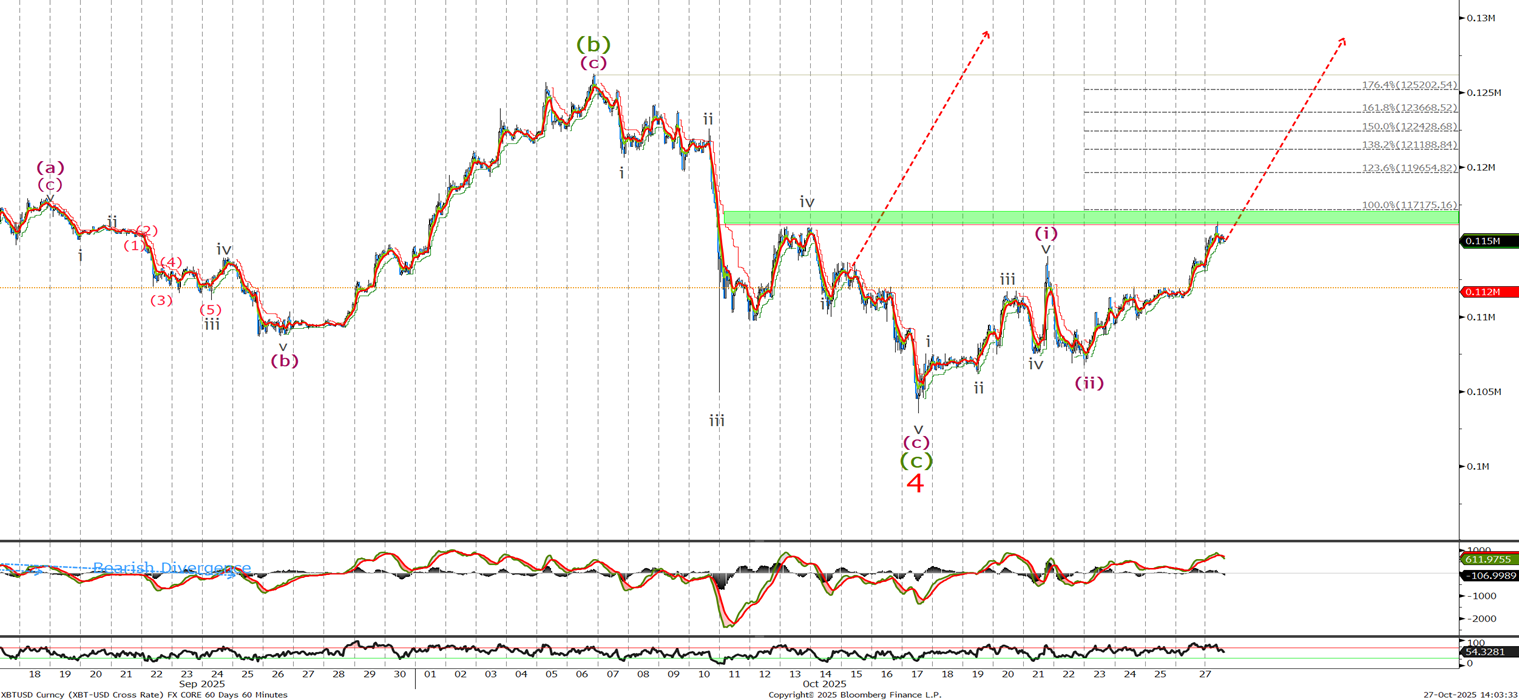
We got stopped out of our longs at 105k before bouncing off the lows previously mentioned. We have since rallied in three waves, so there is the possibility that only wave (A) of a larger flat wave 4 has been completed. The recent higher highs and higher lows in the last few days show a bullish scenario unfolding, with targets for this leg of wave (iii) higher shown. I am buying now at 115,150 with stops again below last week’s low.
Ethereum Long Term Chart
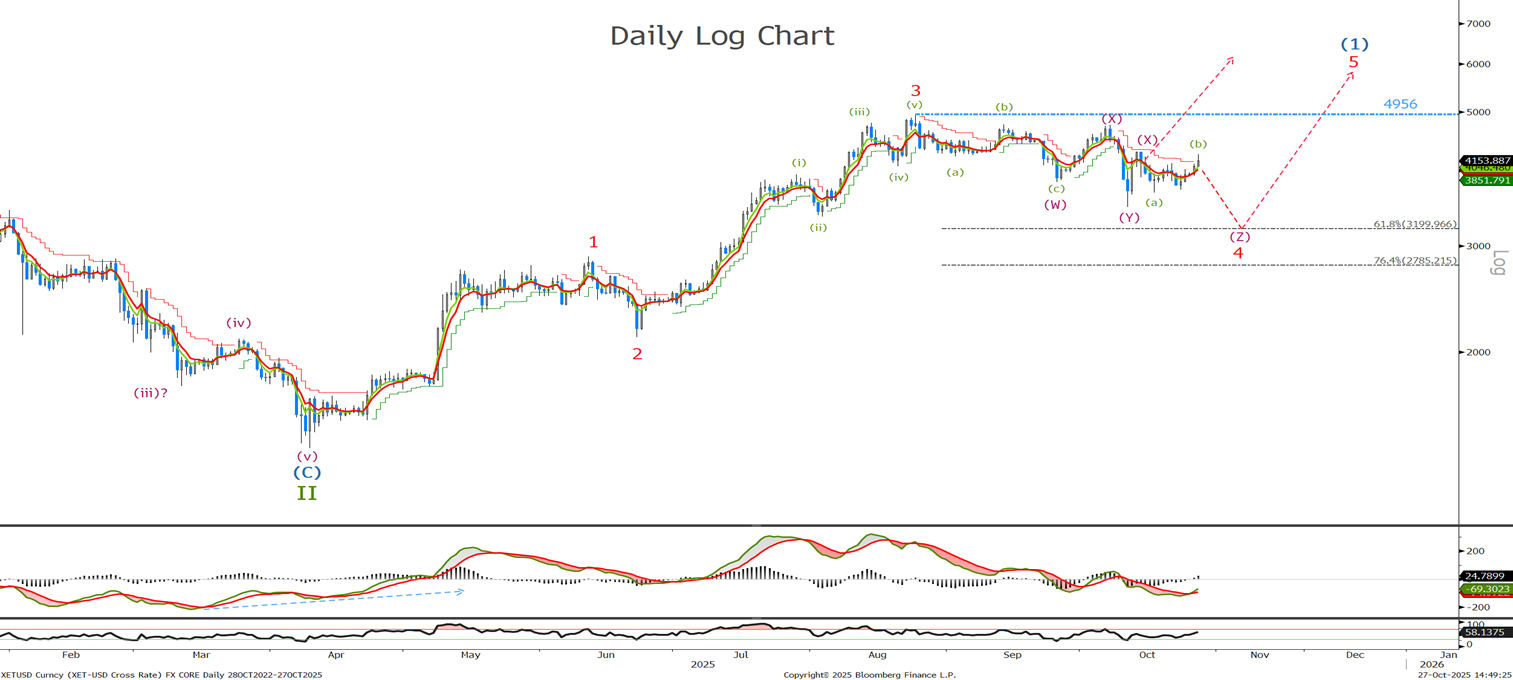
Last time we said ‘Like BTC I am calling the end of the correction and looking for a push to new highs in the coming weeks.’ We have pretty much traded sideways since and the last update , it is possible like BTC that the correction and wave ended at wave (Y) , but given that wave 4s are often more complex I think it may break lower towards the 3200 level , lets try and break the correction down in the short term chart.
Ethereum Short Term Chart
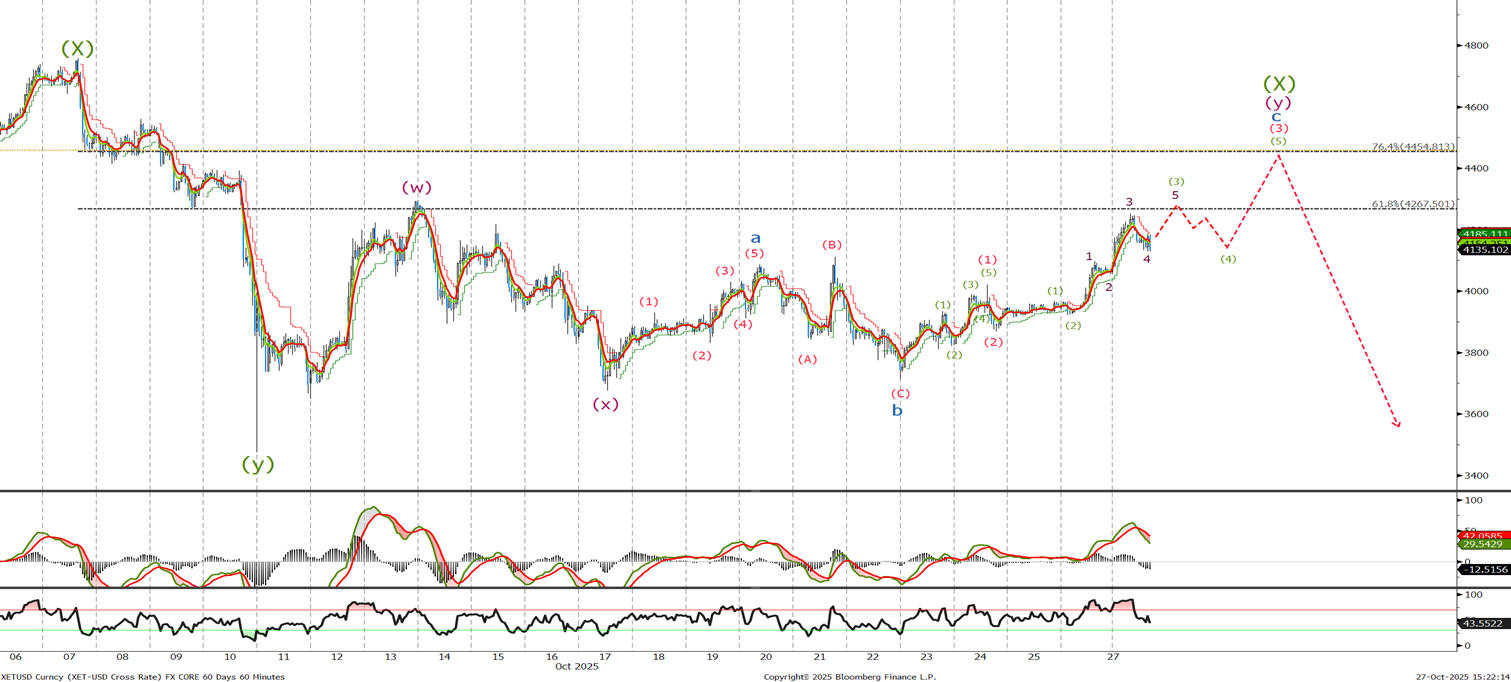
In the very short term, it appears that we should continue higher to either complete wave c of (x). If it continues to rally above 4760 , it will indicate that wave 4 is already complete. So, at least while above 3670, we should remain long, look to close around 4400, and re-enter lower as discussed on the long-term chart or on a break above the 4760 level.