Bitcoin Long Term Chart
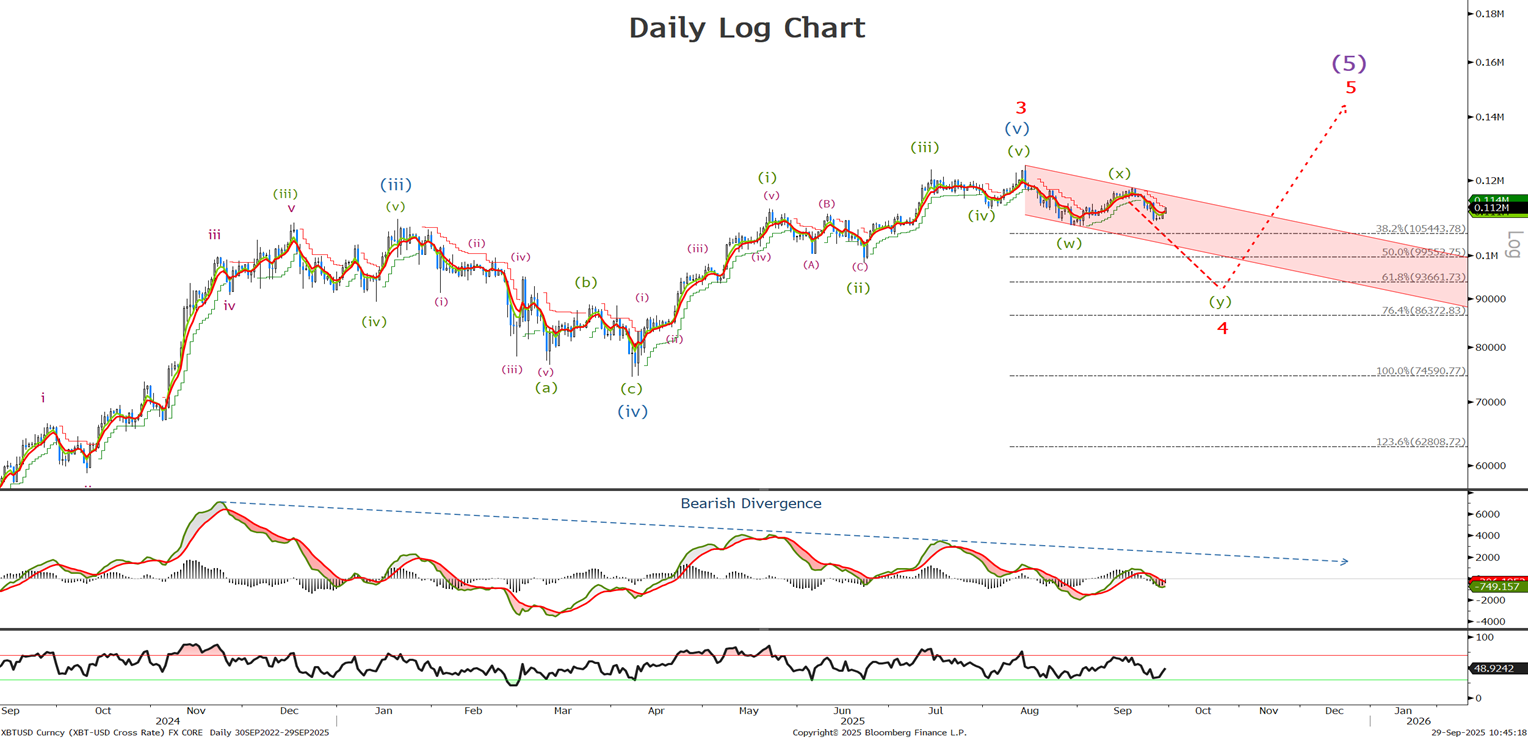
Still ‘no change in our long term view with the second of the 3 wave correction lower underway. If wave (y) is underway we should see a sell off in 5 waves to complete this leg of wave 4 , with targets at 99550 and the bottom of the channel at 93660 , where we should find support, lets see where in wave 4 we are.’ Continue to look for lower whilst below 122k.
Bitcoin Short Term Chart
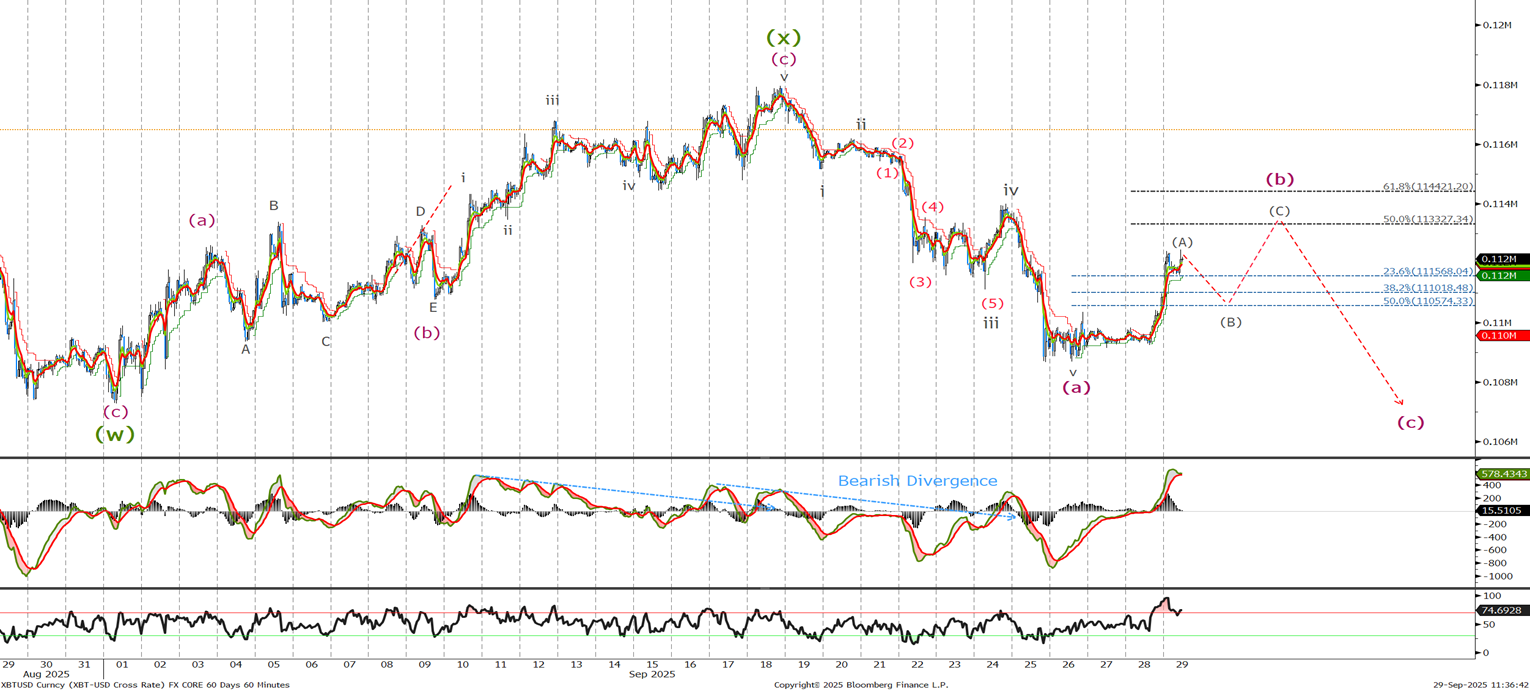
Last time we said ‘it appears we have sold off in 3 waves and are retracing in a minor wave iv.’. You can see from the chart we then sold off to complete 5 waves lower and the end of wave (a) . I am looking for a rally into the 113300 – 114420 area in wave (b) before selling off again towards the targets mentioned on the daily chart. A move back above 118k will put this view into doubt but we will update if it occurs.