Bitcoin Long Term Chart
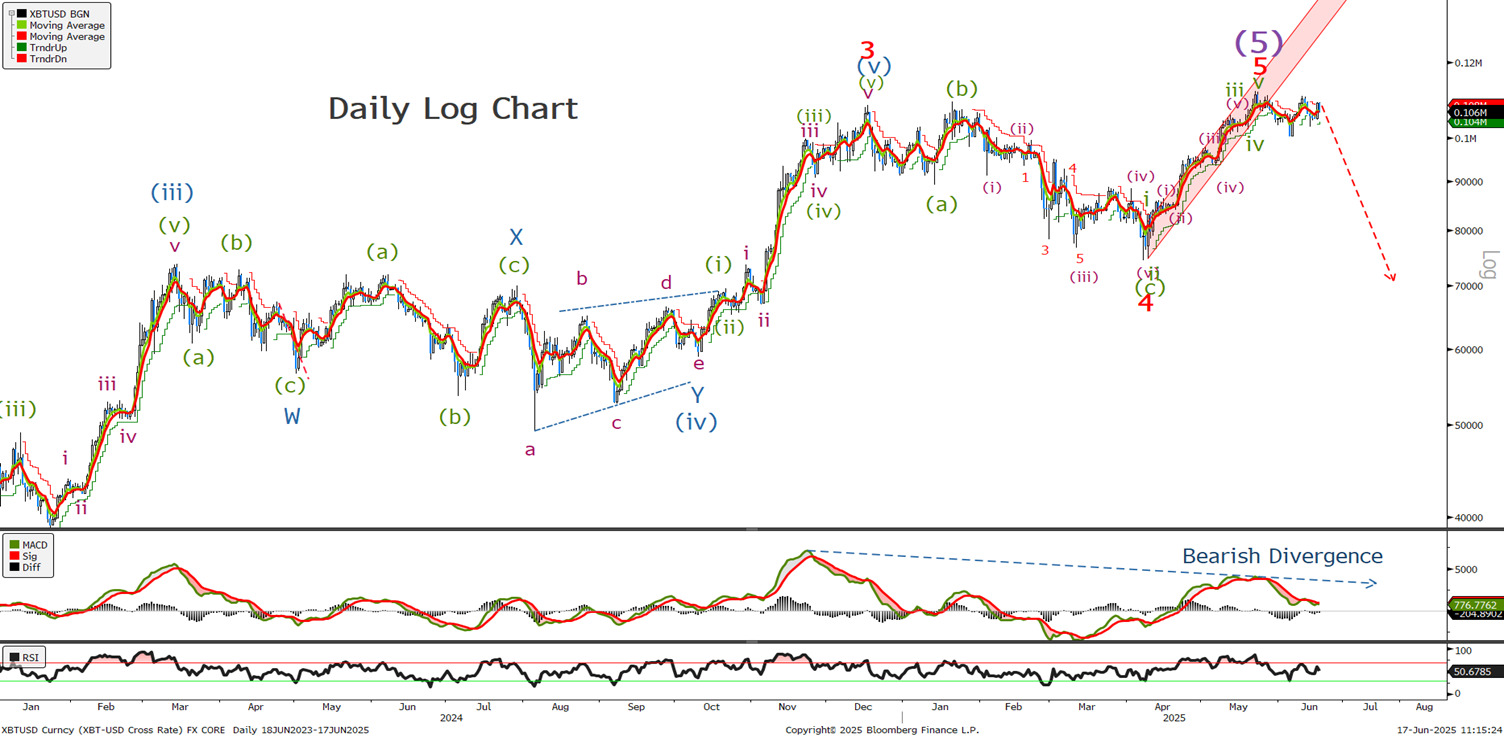
No change as we continue to look for lower whilst below the wave (5) high so remain short with stops at 112500.
Bitcoin Short Term Chart
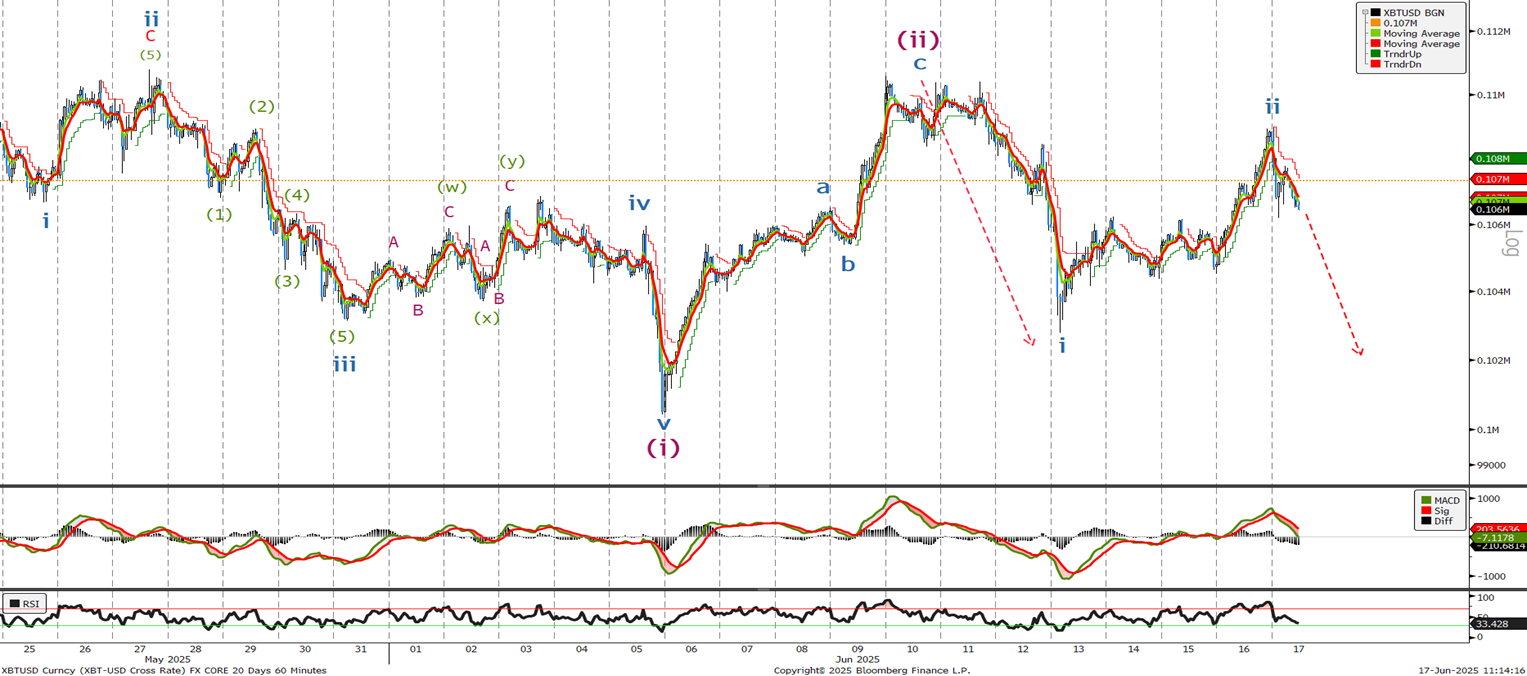
Last time we were looking for it lower and and sold at 109K with stops at 113K . Leave stops there and if not short sell now. We should see an acceleration lower on a break of the wave i low around the 102k level followed by the all important 100k level.
Bitcoin Very Short Term Chart
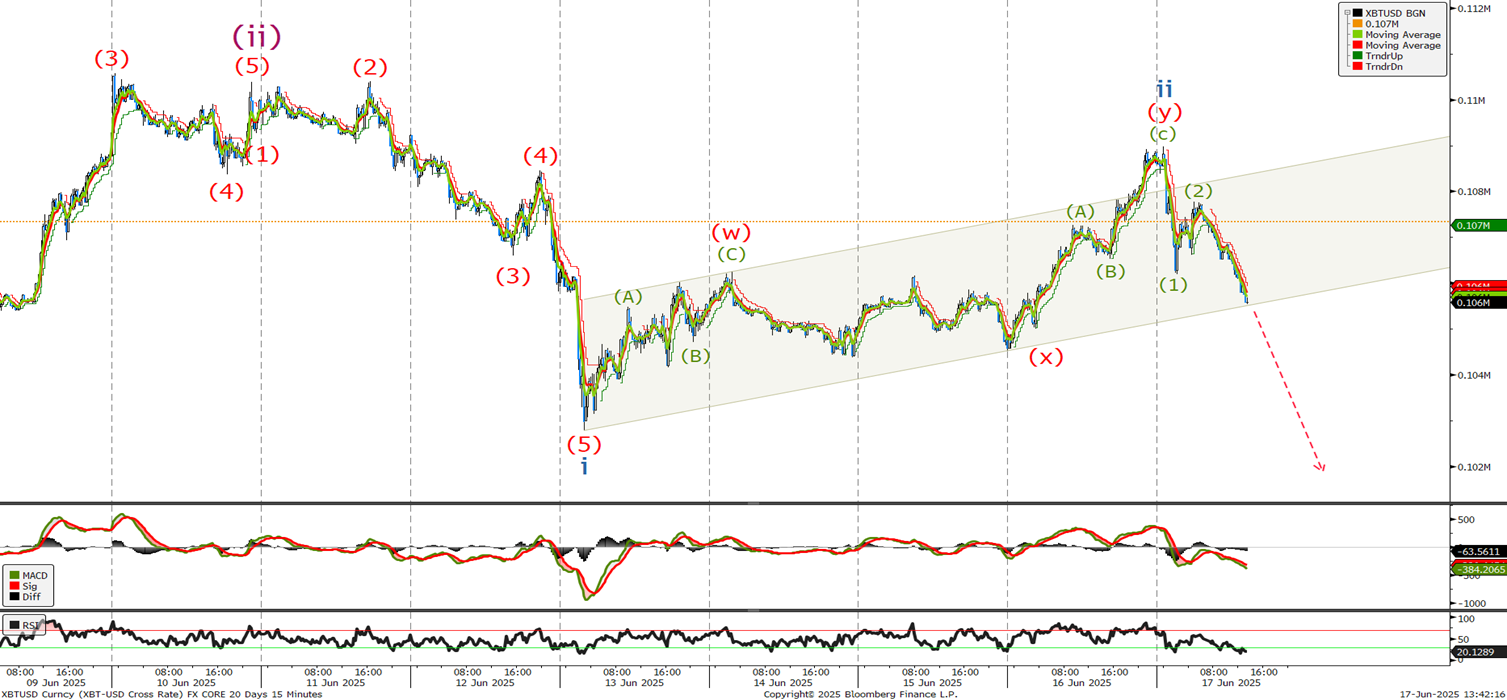
This is a really short term chart showing the 15 minutes time period. Last week I said ‘If this view is correct then we can see that we will need to make another leg higher to complete 5 waves up that must stop below the 112k all time high set in May.’As you can see we traded to just shy of of 111k before selling off. The last 5 days appears to be a corrective rally that is over and I am looking for lower and a break down to test the 102k level and then lower.
Ethereum Long Term Chart
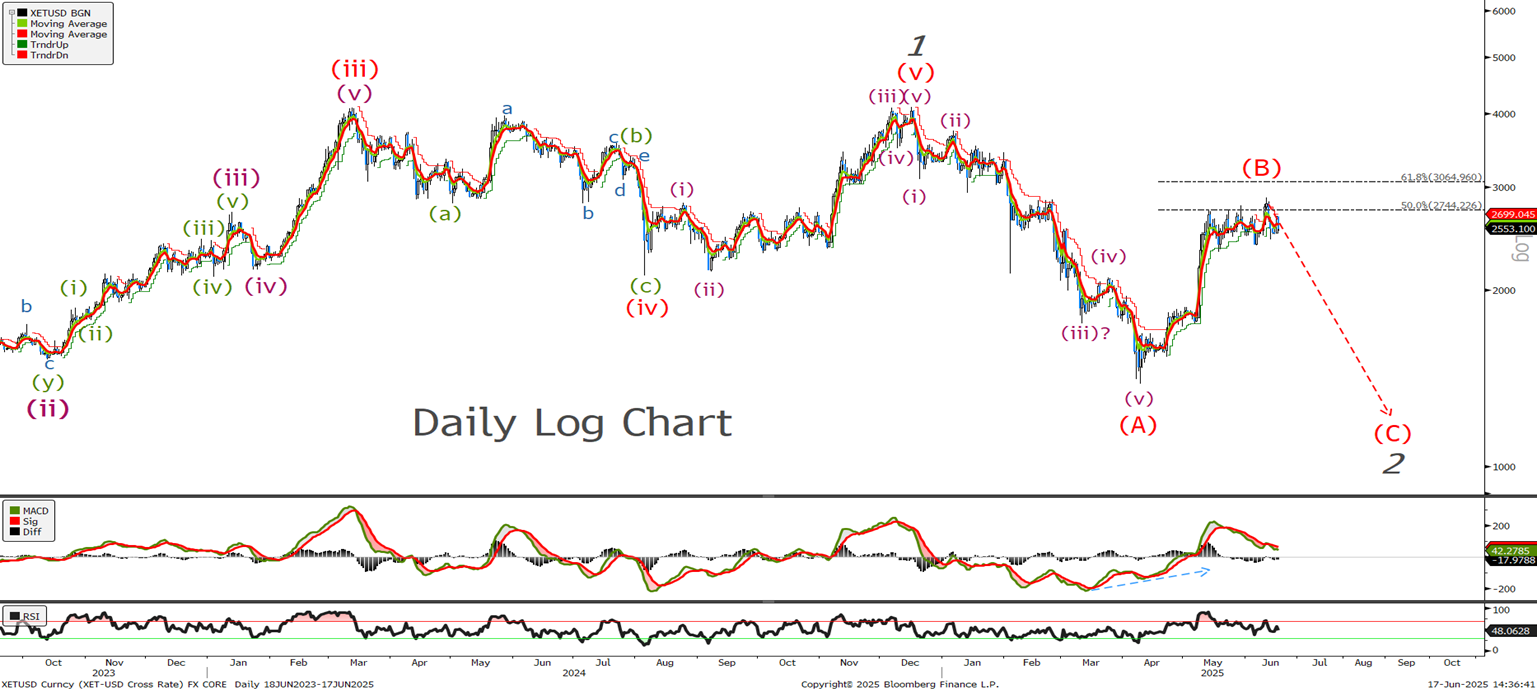
Last time we said ‘I am a little lost with new highs in BTC and ETH struggling behind but it appears we will make a high towards 3060 to complete wave (B) before the next leg lower’A daily close below 2350 will confirm the bearish view. Lets see if any clues in the short term charts.
Ethereum Short Term Chart
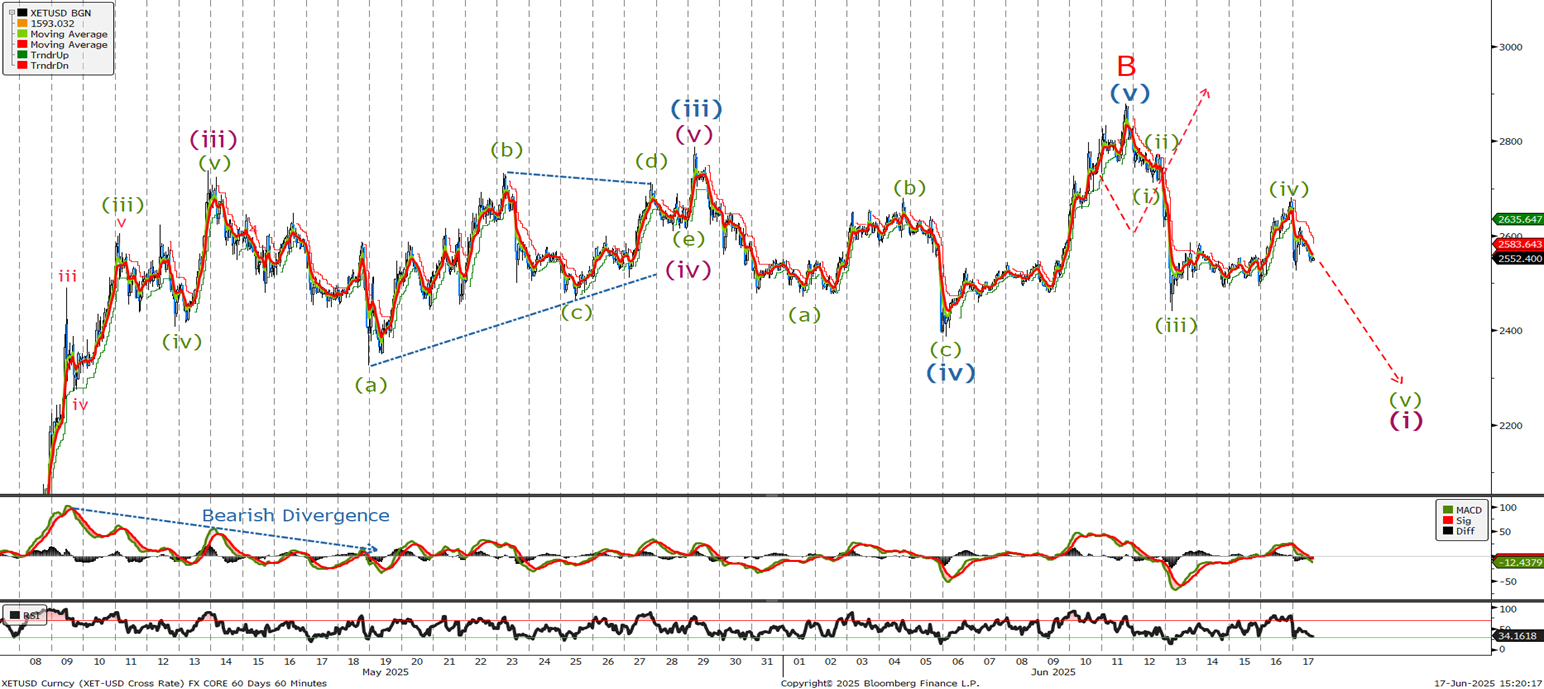
Last time we believed ,due to the long rangebound period , that we were trading within a triangle and was looking for ‘a short sell off before a move back above 2800 to complete wave (v) before a longer term top is in place.’ We traded to 2880 to complete wave B and whilst below that level we will look for lower. Use any retracement to sell into with a break below 2320 expected to see an acceleration to the downside.