

GLOBAL STOCK MARKETS
Global equities entered the second half of this year after one of their strongest rebounds. In early July we noted that market risks had become increasingly asymmetric and questioned the prevailing calm: equities stood at record highs, oil had probably fallen too sharply, while weaker June jobs data seemed to give policymakers greater scope to pause and assess incoming data.
The quarter was characterized by a more volatile market path, with global equities moving through periods of weakness and renewed strength while ultimately ending broadly around early-summer levels. The S&P 500 gained 2.3%, while the equal-weighted S&P 500 fell about 1.9%, a sign of weak market breadth. In Europe, the German DAX was flat in US Dollar terms and the French CAC lost 5.5%.
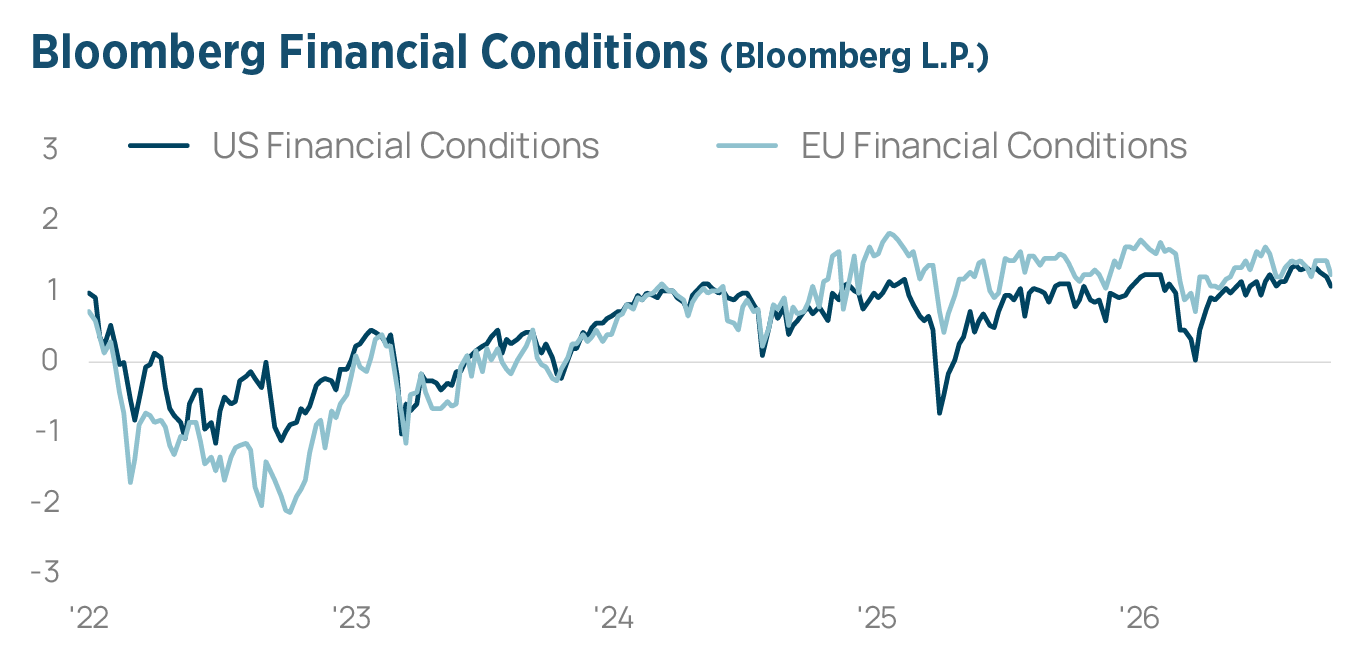
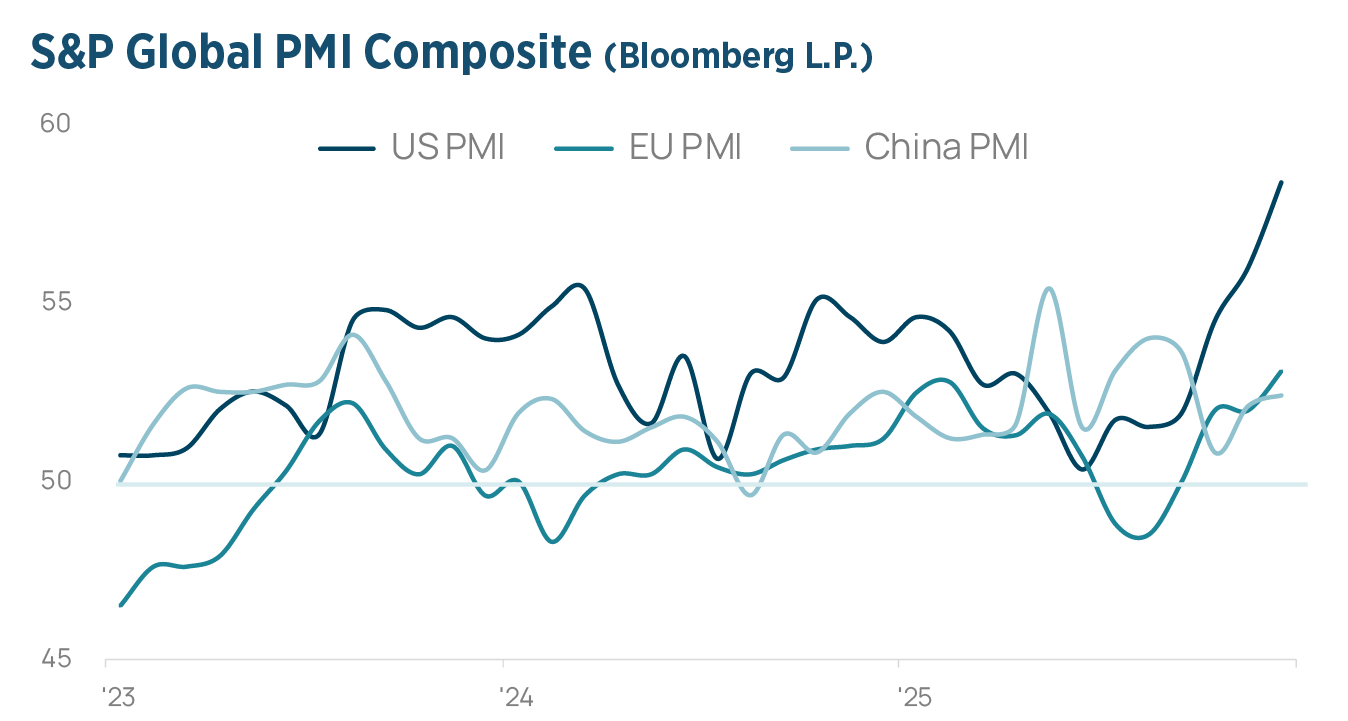
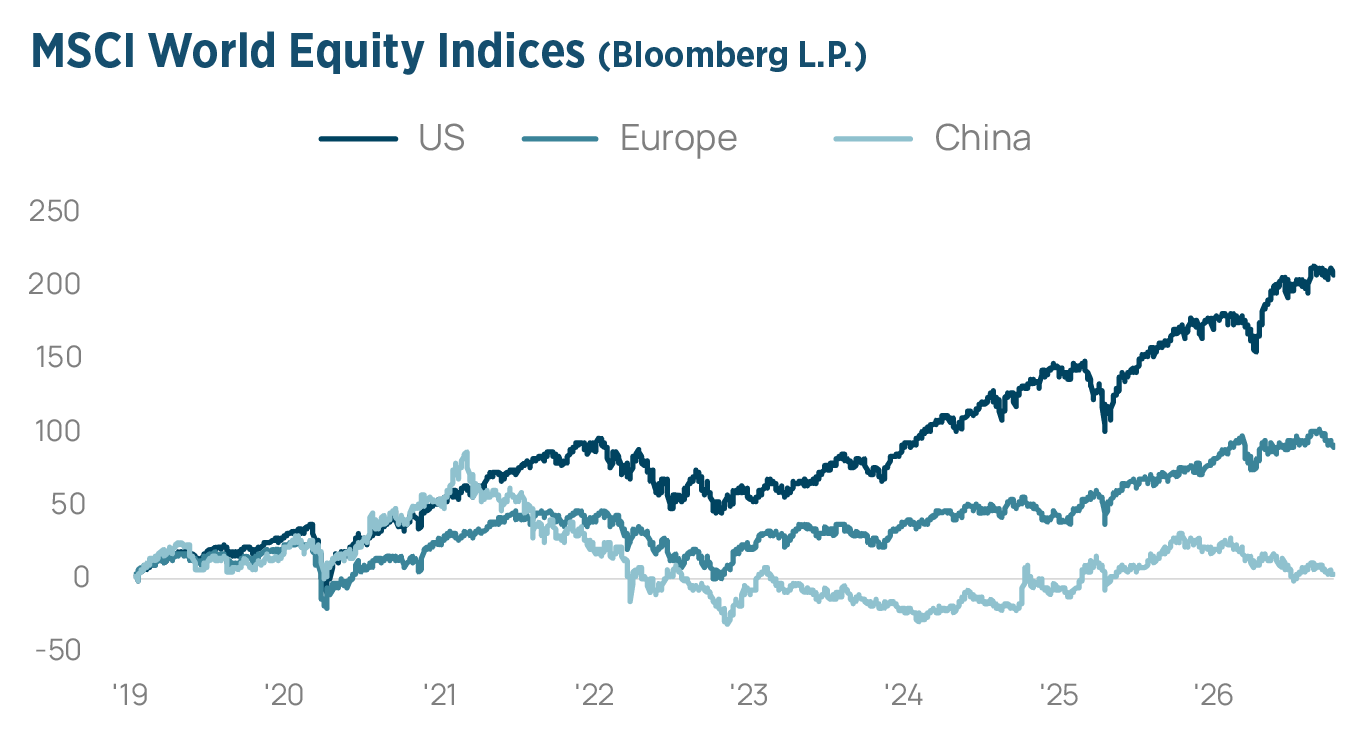 Oil prices rose again as the conflict in the Middle East escalated after failed ceasefires, rising global yields gained traction as a topic, with research increasingly examining their potential impact on equity markets, and the FED’s rate increase in September kept all eyes on monetary policy. Financial conditions in the US and Europe nevertheless remained positive, earnings were strong, and September business surveys carried the momentum: the S&P Global PMI Composite for the US reached a new five-year high of 58.4, and the Eurozone reading of 53.1 a three-year high. Consumer sentiment was at its lowest since the early 1980s on the Michigan survey and its lowest since 2014 on the Conference Board measure.
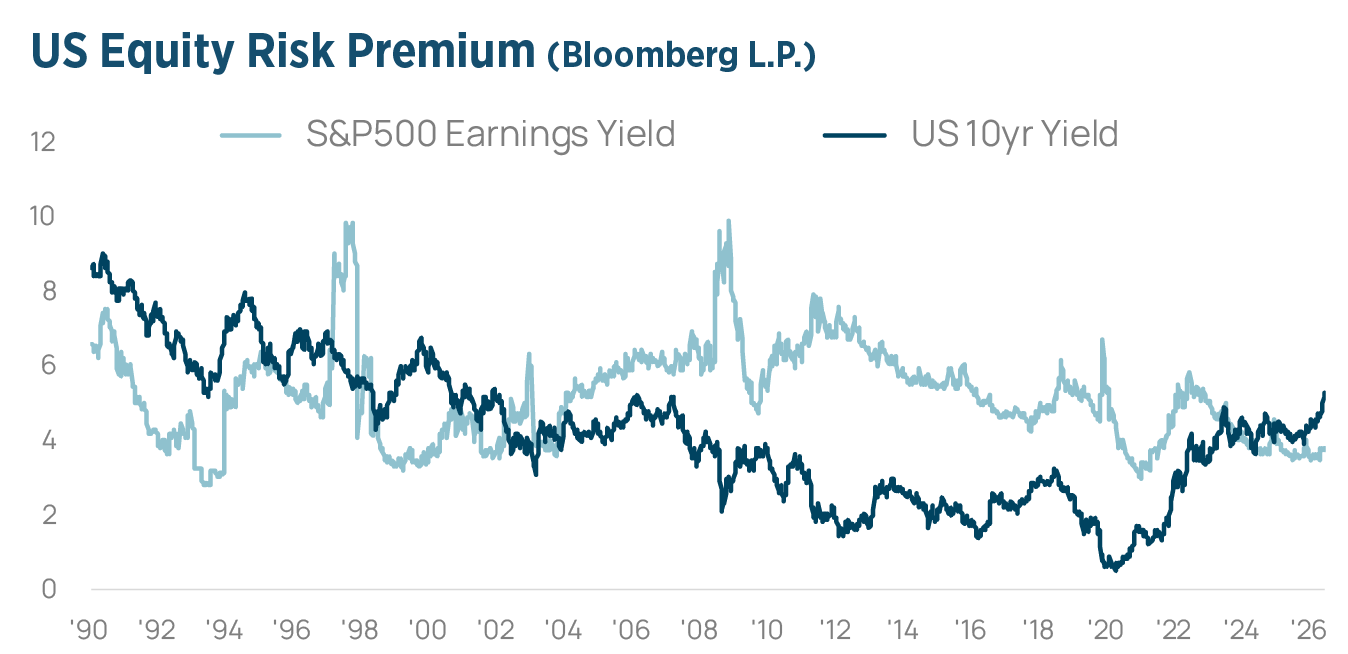
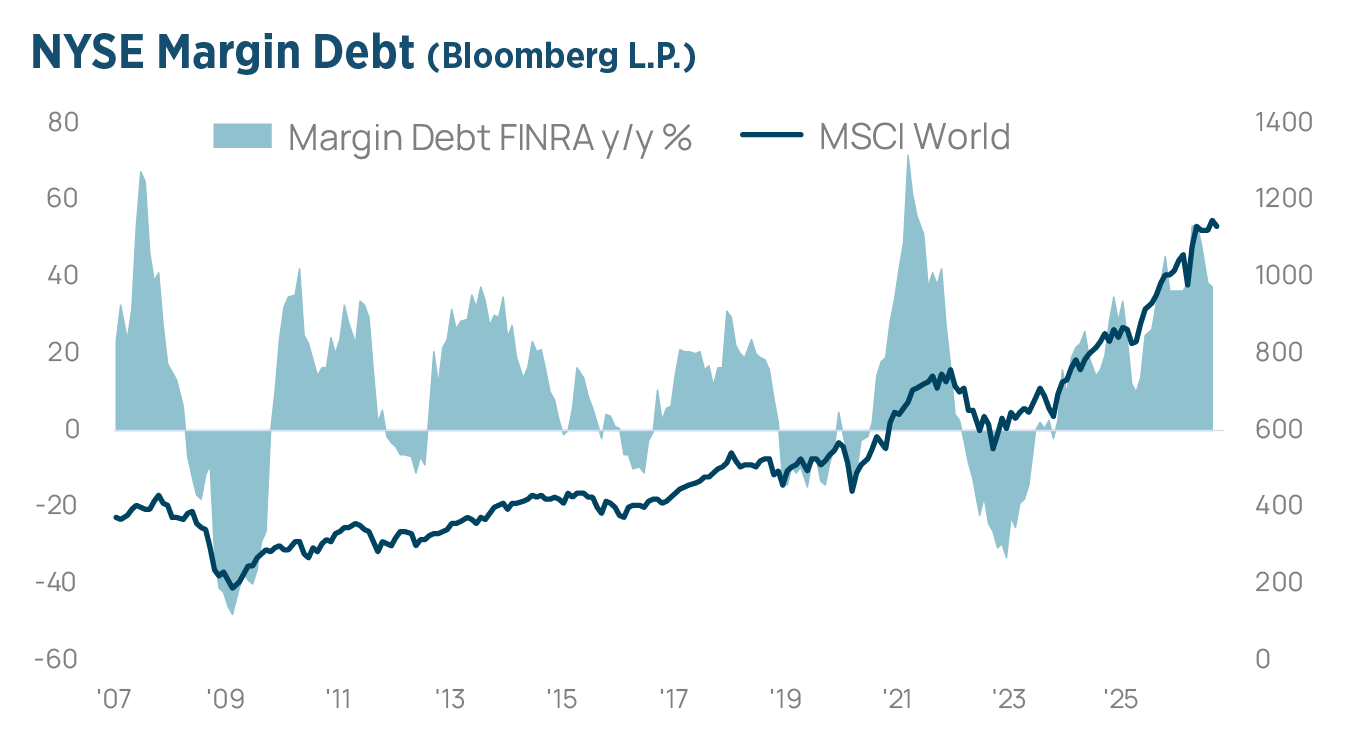 The AI narrative came under pressure: several top executives cautioned about the pace of development and urged a slowdown, while OpenAI’s decision to postpone its IPO to 2027 brought the financing of the AI investment cycle into sharper focus. Leverage told its own story: FINRA margin debt, at a record 1.5 trillion Dollars in June, fell markedly in July and came back up to 1.45 trillion Dollars in August. September brought the second-largest options expiry ever, rising bond volatility weighed on global liquidity, and the S&P 500 earnings yield remained below the US 10-year Treasury yield. A lot happened in the world, from monetary policy to geopolitics to AI. Index levels reflect only part of it, as what politicians and monetary authorities tried and said mattered just as much.
 The US mid-term elections on 3 November add another layer of uncertainty: options markets price a muted reaction, yet the weeks before midterms have historically been choppier. The third quarter can be described as « Equity Calm, Macro Turbulence »: a tug-of-war in which earnings and nominal growth still beat the discount-rate and geopolitical shock, but volatility across bonds, FX and commodities showed that the macro regime had changed. The overarching themes defining the secular framework are deglobalization, innovation and fiscal dominance.
 The AI scare does not change the bigger picture: this is a global technological transformation, and portfolios cannot do without exposure to it. It calls for selectivity, however, as the winners will be companies with genuine demand visibility and earnings power rather than every name that carries the AI label.
GLOBAL FIXED INCOME MARKETS
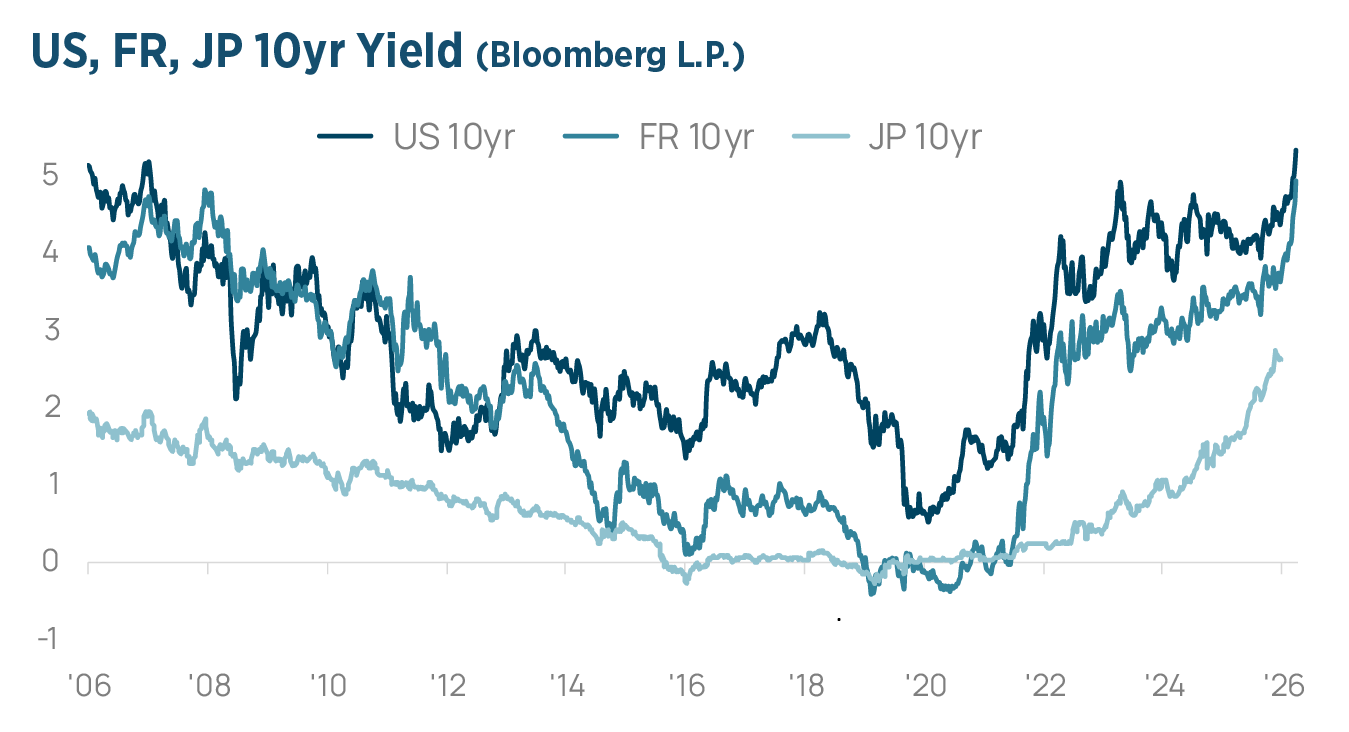
It was a bad quarter for bonds, as yields rose globally. The Japanese 10-year reached its highest level since 1996 and the US 10-year its highest since 2002, marginally above its 2007 peak, while the French 10-year yield spiked above those of Italy and Greece, until recently the riskier names. After years of ultra-low rates, the move is a stunning reversal, yet takes interest rates back to their historic norm. With US nominal GDP growing 6.3% year on year in the second quarter, the US 10-year had room to rise.
 FED Chair Warsh left rates unchanged in July and was reluctant to signal higher rates despite elevated inflation, leaving markets uncertain. At Jackson Hole in late August he described the 2% inflation target as firm and fixed, and in September the FED raised rates by 25 basis points, its first hike in three years. The ECB also raised rates in September, its second increase since June, and signalled more to come.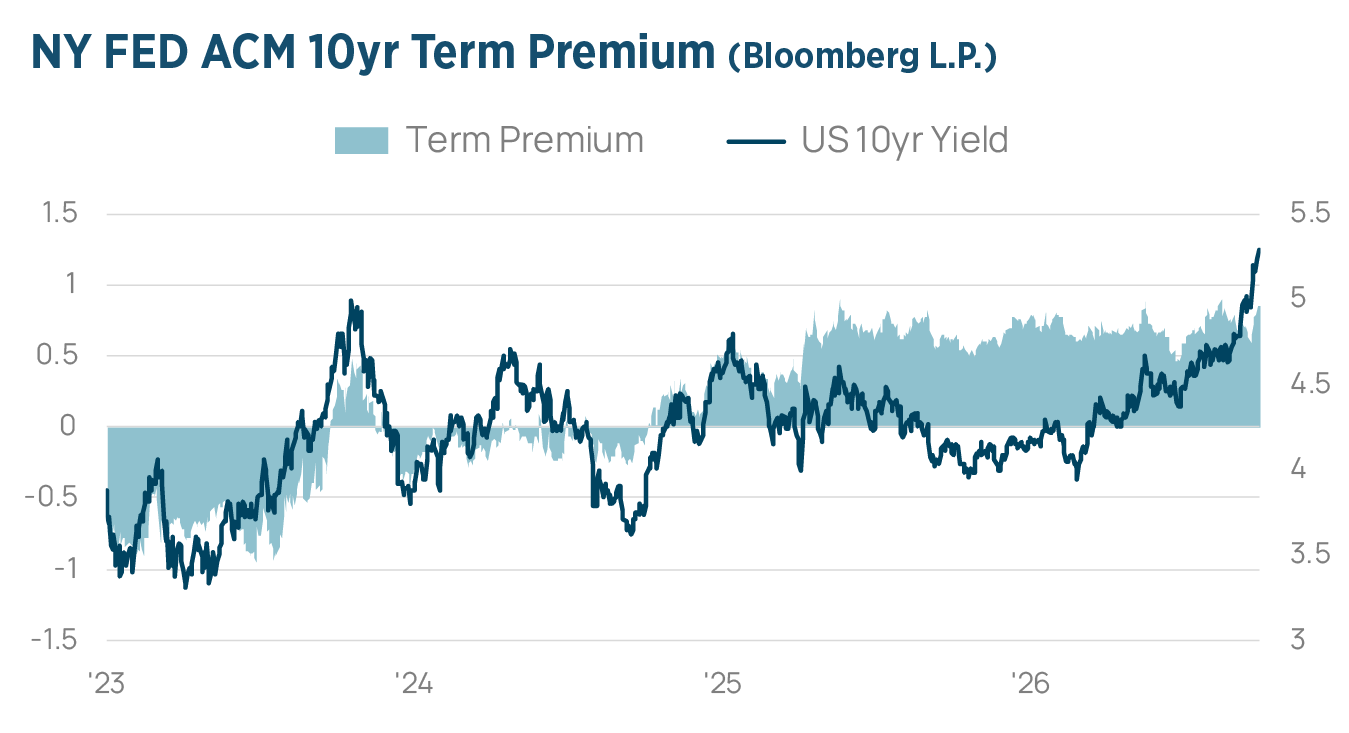
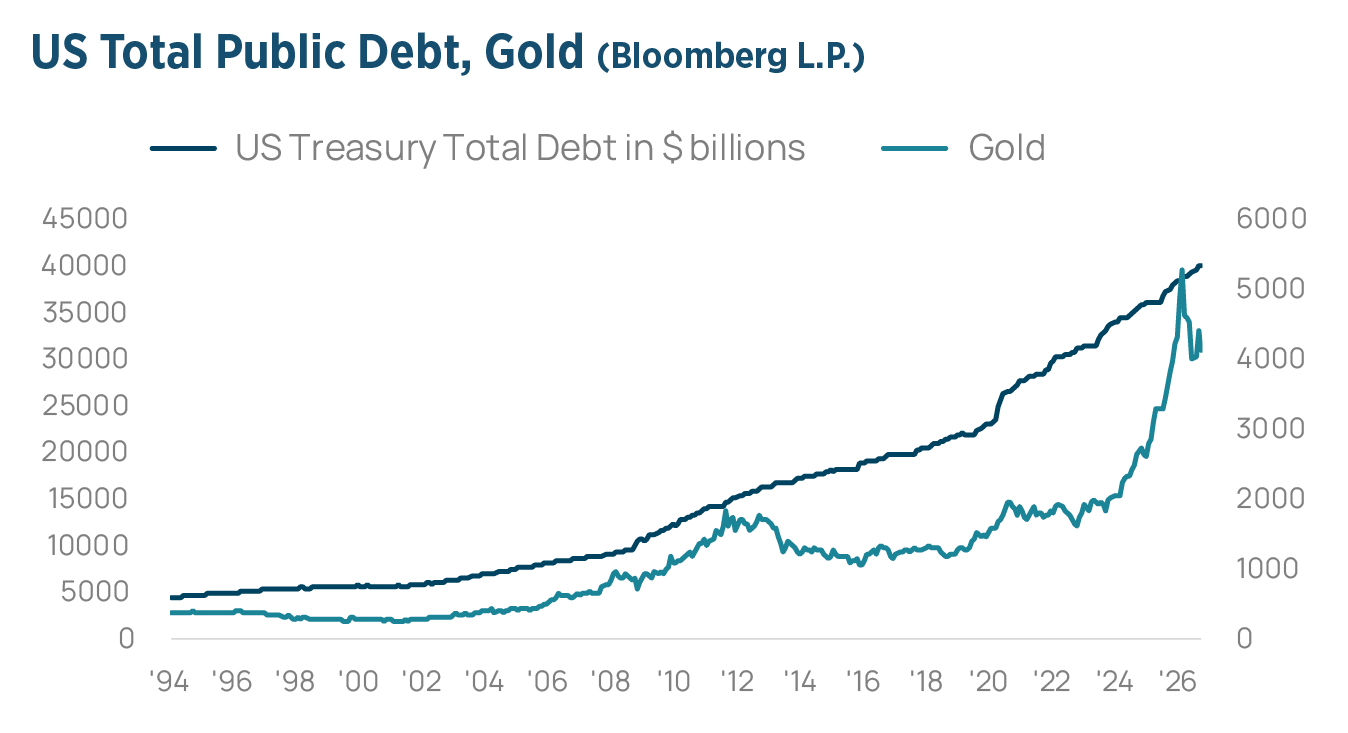
The US Treasury announced larger buybacks in August. Buybacks are a routine liquidity and market-functioning operation introduced under Secretary Yellen, but scaling them up amid rising yields drew questions about secondary motives. Supply and inflation pointed the same way: more private-sector issuance, including AI-related financing; larger fiscal deficits, with US public debt above 40 trillion Dollars in August; oil higher after renewed conflict in the Middle East; and inflation data ticking up again.
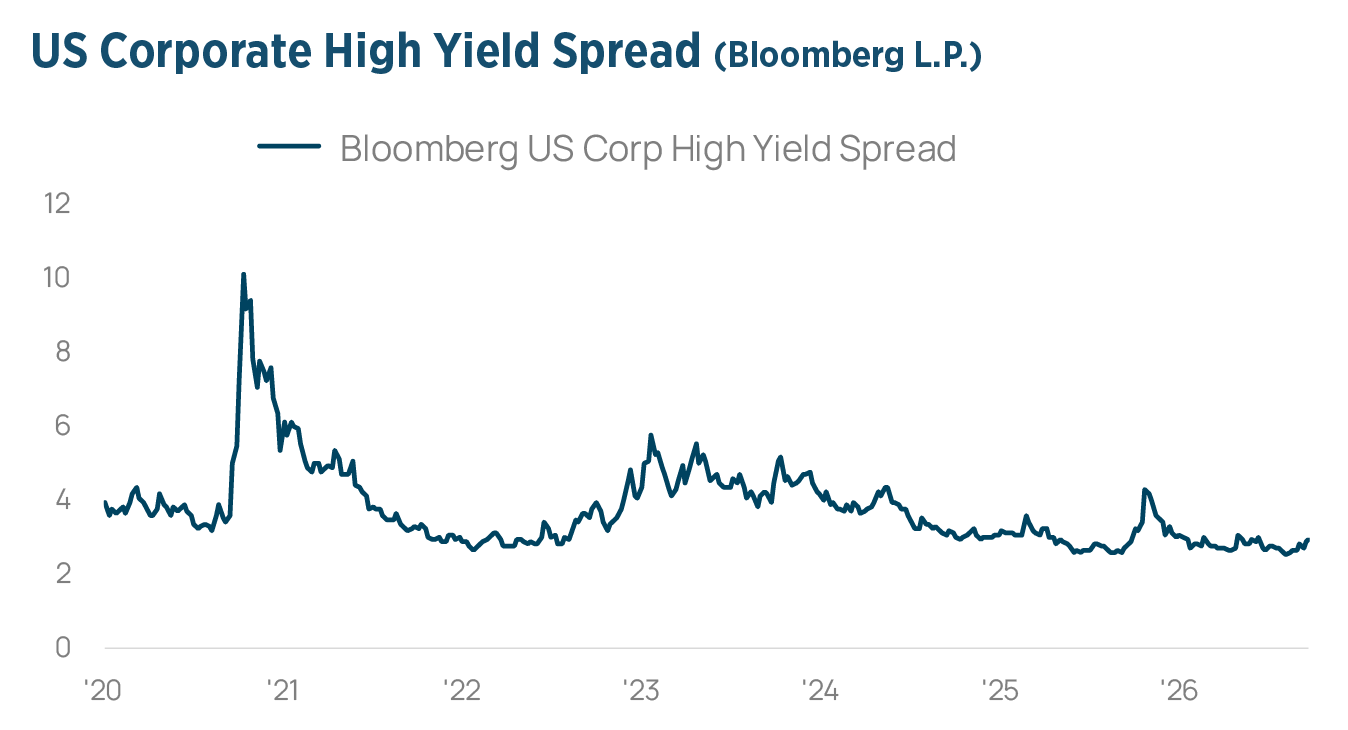
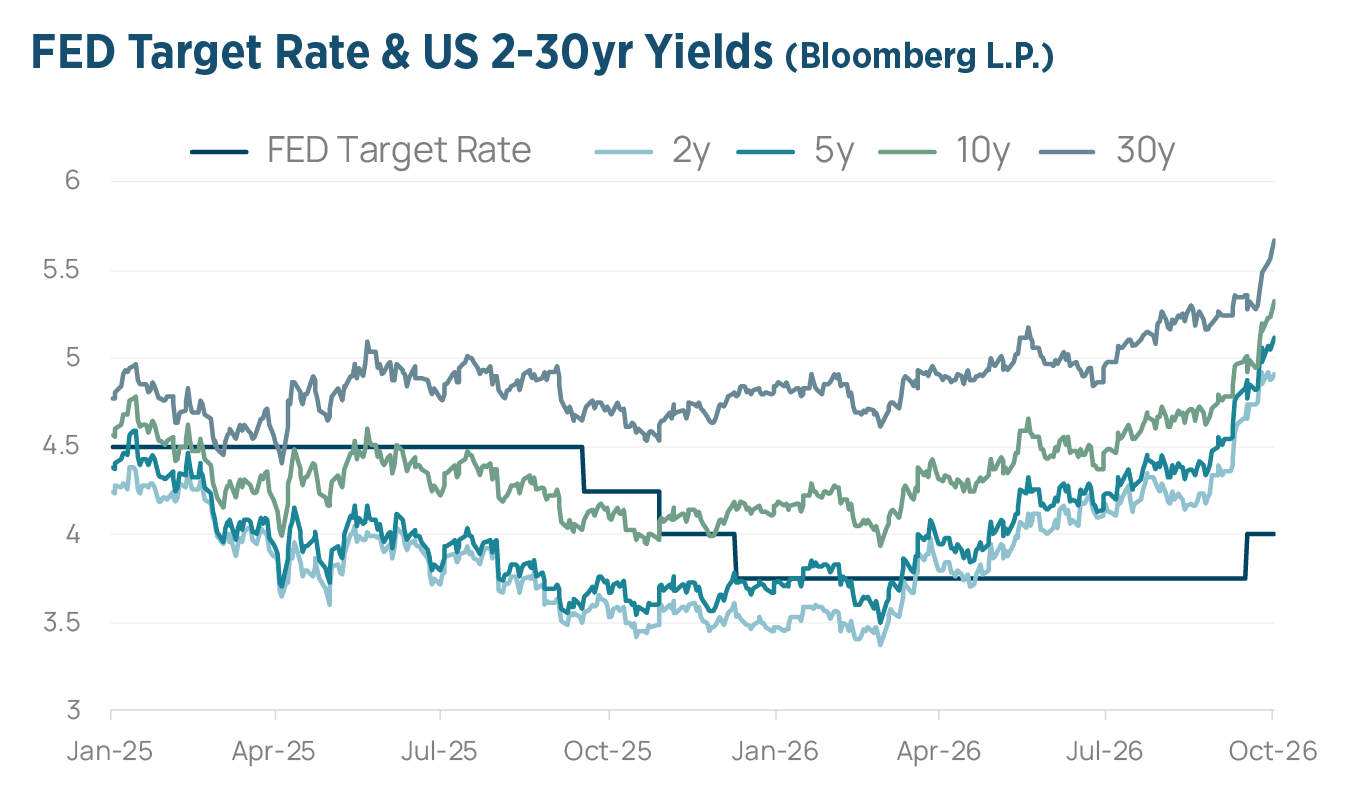 Rate expectations swung accordingly. In February, markets priced two 25 basis point FED cuts for this year; after the September hike they priced almost four further hikes by end-2027, a repricing that may be too aggressive. Looking back, the six cuts from 5.50% in September 2024 to 3.75% in December 2025 invite the question of whether all of them were warranted. The term premium remained relatively stable despite higher yields, suggesting potentially defensive cross-asset positioning, as Treasuries could attract temporary demand as a safe haven in a risk-off, liquidity-strained environment. Credit, long resilient to higher rates, began to show signs of strain in September, with the Bloomberg US Corporate High Yield Average Spread widening by 60 basis points from end-August – not much by historical standards, but an early warning sign.
US DOLLAR
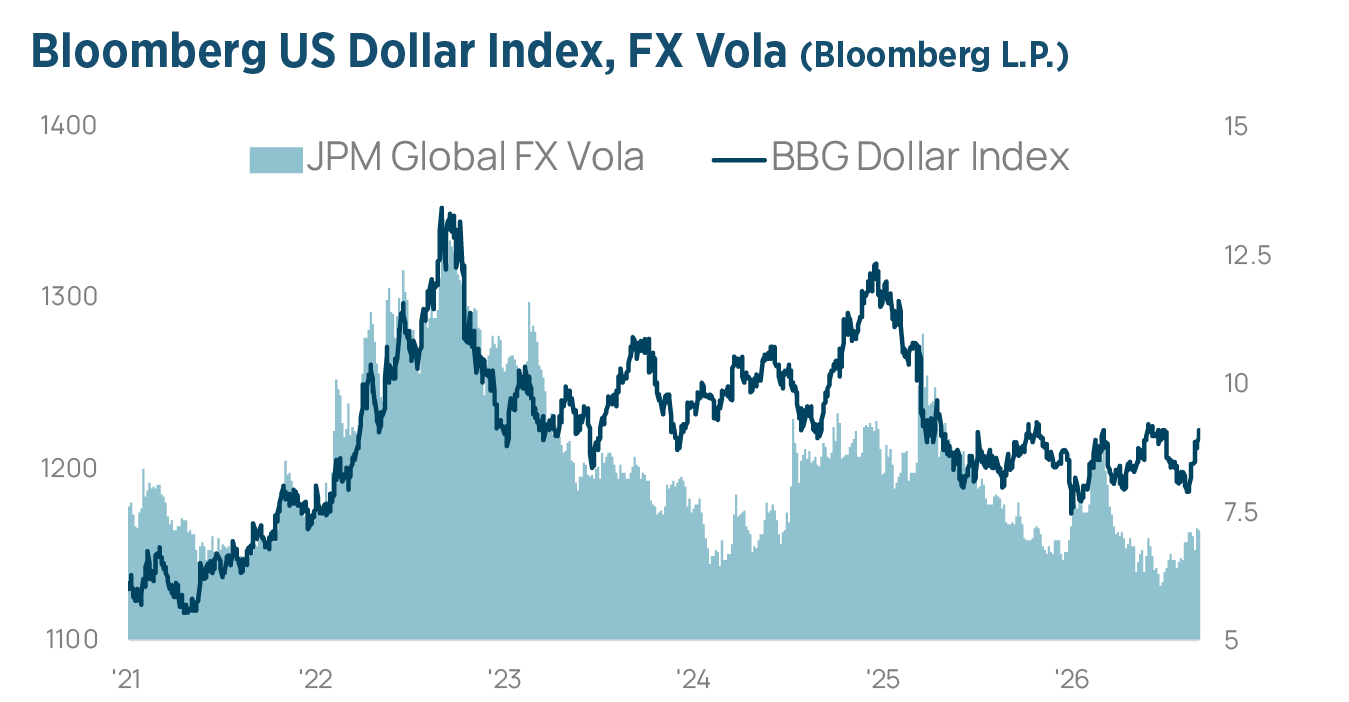
The US Dollar came under pressure as currency markets were shaken by a major intervention. The Yen was the focal point: after it approached a four-decade low near 164 per Dollar, Japan intervened, backed by the US Treasury. Pressure intensified on August 19, when Treasury Secretary Bessent announced an unscheduled decision to double the Treasury’s bond buyback programme to support market liquidity. In the same week, gross US national debt crossed the 40 trillion dollar threshold. Weak US economic data added to the pressure, which reversed in September as a hawkish FED tone, firmer interest-rate outlook and stronger economic data lifted the Bloomberg Dollar Index by almost 2%.
 Beyond the cycle, the global monetary system is shifting towards a multipolar structure, with the US and China using different strategies to gain influence. The US relies on financial technology and the development of Dollar-pegged stablecoins. China works on the internationalization of the Yuan and a gradual reduction of its dependence on the Dollar, through a dual strategy of Gold accumulation and its own digital currency. Together with the prospect of currency adjustment in China, this keeps the FX market in focus: as we noted at the beginning of the year, 2026 continues to be a very interesting period for currencies.
COMMODITIES
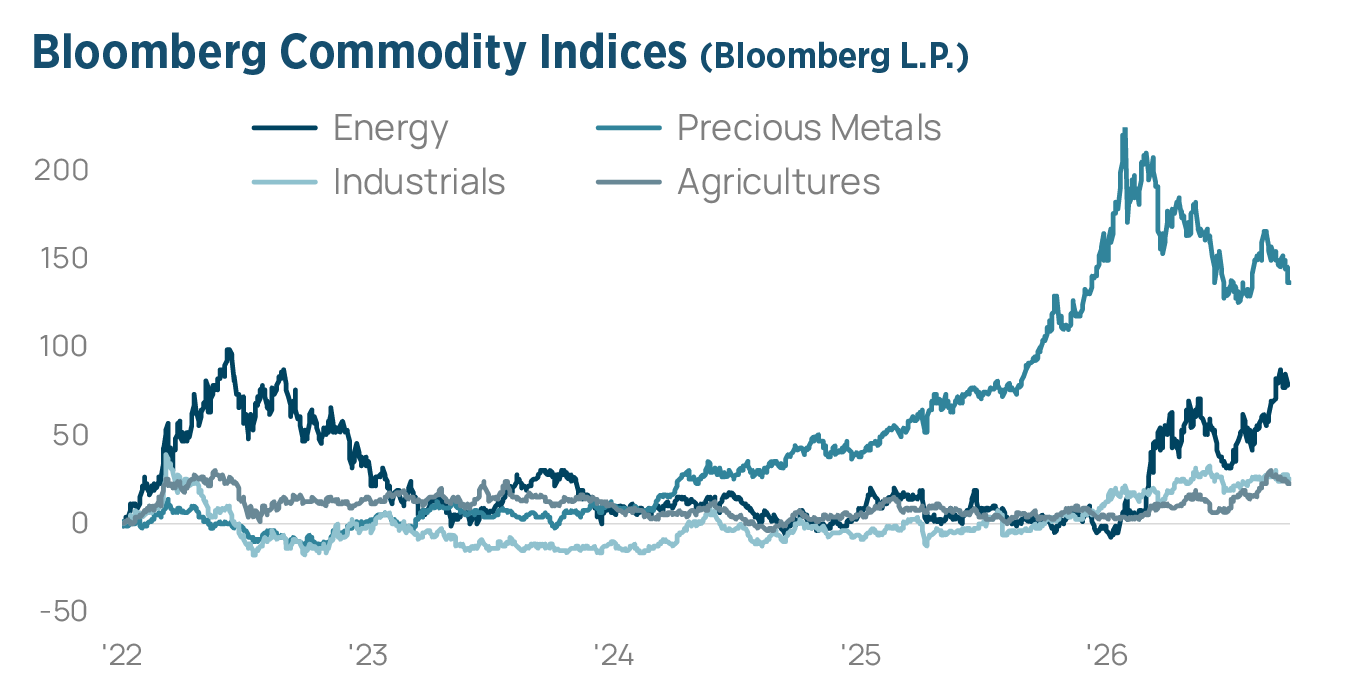
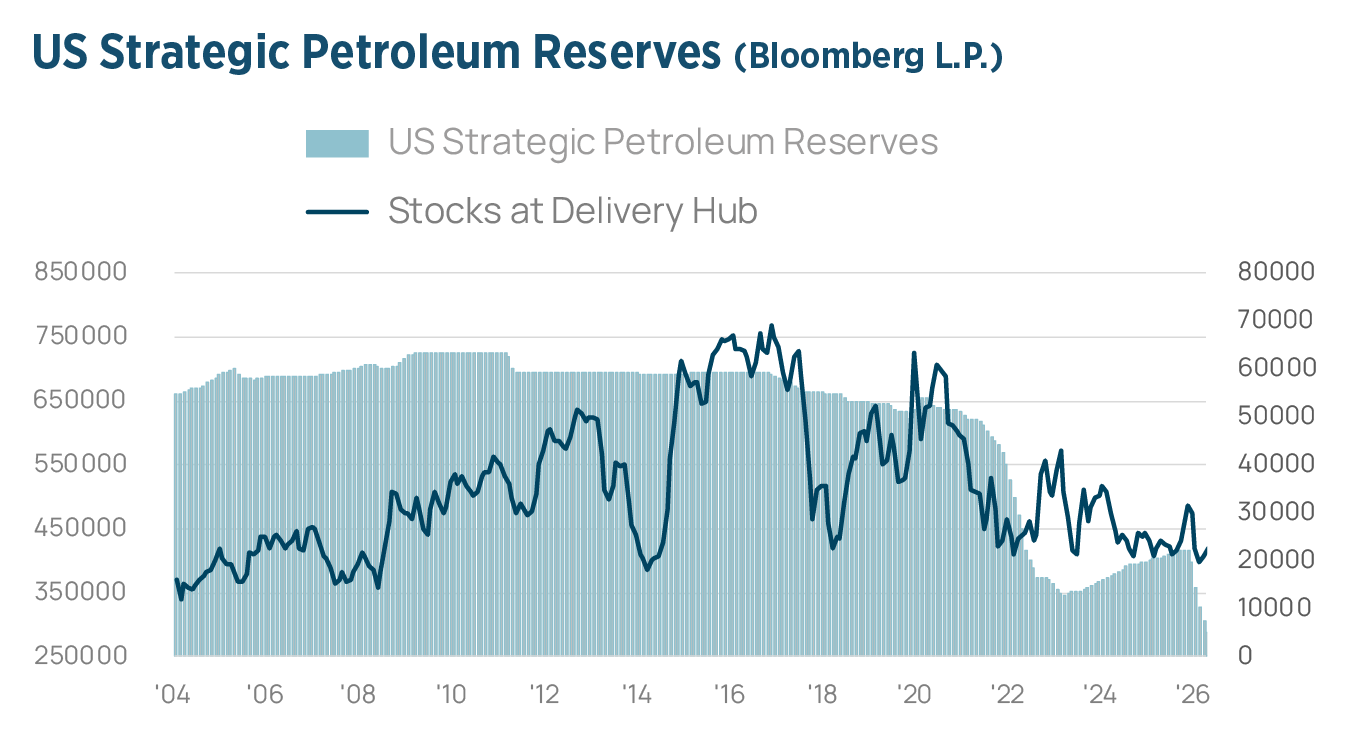
The Bloomberg Commodity Index rose 16% in the third quarter, taking its gain for the year to 33%. Energy led with +34% (+86% year to date), Precious Metals gained 2% and remain 8% lower for the year, Agriculture rose 13% (+18%) and Industrial Metals 4% (+11%). At the start of the quarter, we pointed to a market that had become vulnerable to a reversal: combined short positions in WTI and Brent had climbed back toward their late-2025 highs, increasing upside asymmetry once again. That is exactly what happened. Brent rose back above 100 dollars per barrel, with refined products such as diesel moving higher still. 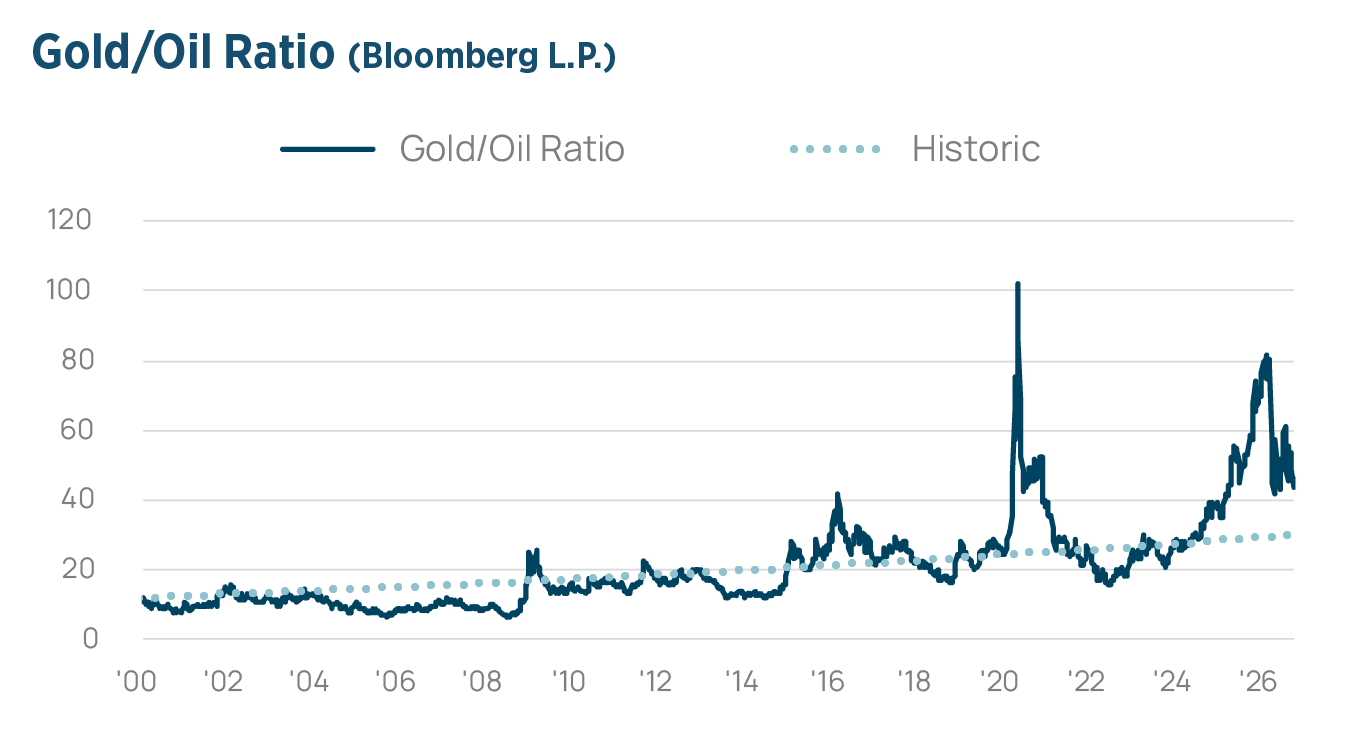
Gold advanced in August, then gave back ground in September as a stronger Dollar and rising yields reasserted themselves. We read this as consolidation rather than a change of trend: Gold remains a necessary portfolio hedge against monetary inflation, and its medium- to longer-term upside is not exhausted. In agriculture, it is not yet a scarcity story but increasingly a vulnerability story: comfortable headline inventories mask rising weather risk, constrained Black Sea trade and renewed pressure across energy, fertilizer and logistics. Official outlooks indicate a probability of more than 90% that strong El Niño conditions will persist solidly through the winter. Strong El Niño years have historically meant higher prices for grains, beans, livestock, poultry and palm oil.
 Commodity allocations remain low relative to the size of global financial assets, and beyond Gold, the shift towards real assets has barely begun. This makes the starting point more relevant than the end point: even a modest increase in strategic allocations would be large compared with the capital currently invested in the asset class. The macro environment has changed dramatically, yet strategic asset allocation has changed surprisingly little.
MACRO
The case for commodities is no longer simply cyclical; it is increasingly structural. Years of underinvestment, combined with rising demand from electrification, energy security, defense spending and deglobalization, point to prolonged supply constraints across many raw materials. Commodities deserve to be viewed as a core strategic allocation, not simply as a niche inflation hedge. China could provide the next impulse, yet the PBoC has held back so far. It needs to tackle the debt deflation.
 Further domestic deflation would worsen the real debt burden, making monetary expansion and some form of currency adjustment more likely than a prolonged adjustment through falling wages and prices. The two liquidity cycles work differently. US liquidity tends to flow first into financial markets. Chinese liquidity, given the breadth of its value-chain network and its industrial reach, influences commodity markets first, and gold in particular, as currency adjustment becomes more likely.
 The post-Cold War era of globalization has given way to a more fragmented world in which economic policy is shaped by national security. Tariffs, sanctions, export controls and industrial policy have become strategic tools, and as resilience takes precedence over efficiency, geopolitics increasingly shapes markets and capital flows.
 The dominant secular themes are deglobalization and innovation, and the balance of power is shifting from monetary to fiscal policy. As we wrote in our first-quarter 2019 letter, today’s markets can only be understood through the sequence of crises and policy responses, from the dot-com bust and the banking crisis of 2008 to the sovereign balance-sheet expansion that followed. The pandemic ended the four-decade bull market in bonds and ushered in a new commodity cycle. While these secular forces shape the landscape, liquidity remains the dominant cyclical driver of financial markets, and increasingly of the broader economy itself.
TACTICAL ALLOCATION
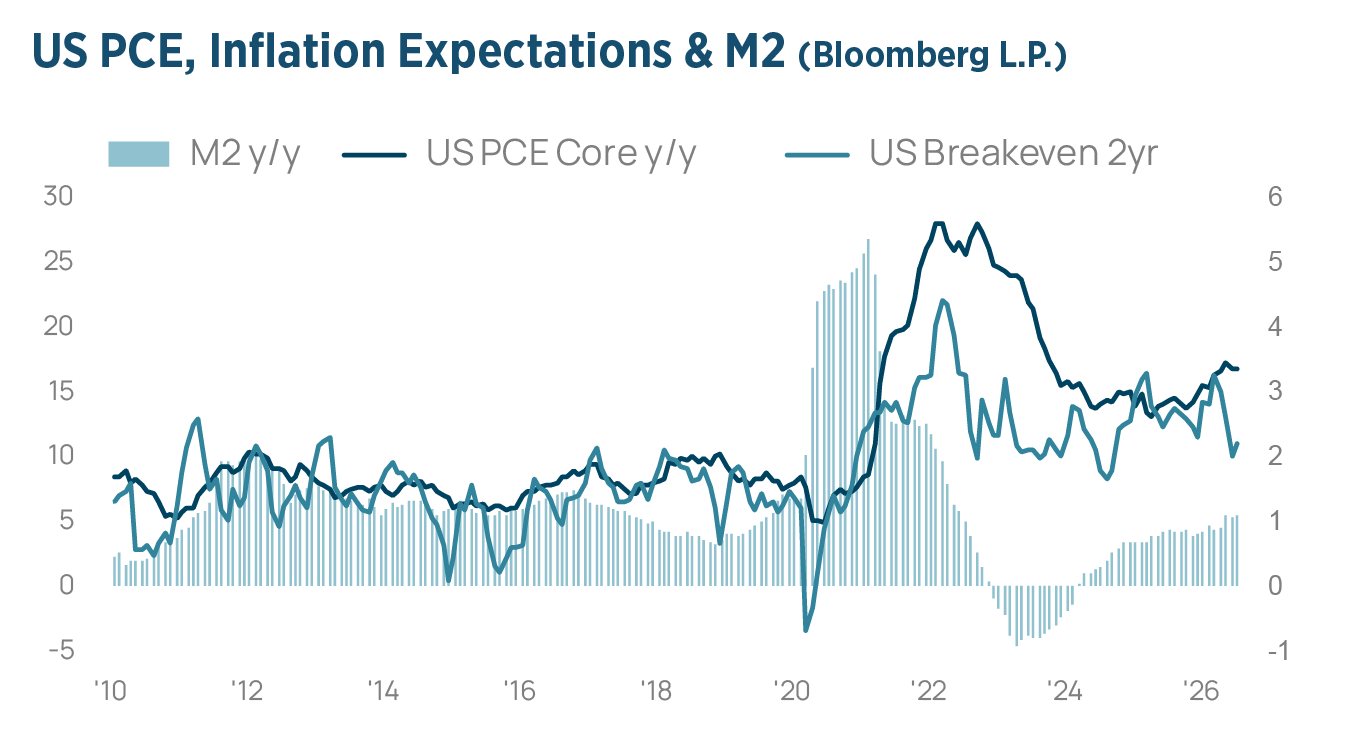
 The inflationary forces are structural and secular, driven by higher debt-loads, demographics and on-shoring of manufacturing. We had been in an interim period from 2022-2025 of significant disinflation. As it turns out, unsustainable sovereign debt dynamics and wars can create bidirectional feedback loops. Wars generate more unsustainable debt, while high debt levels can force critical political decisions that spark war.
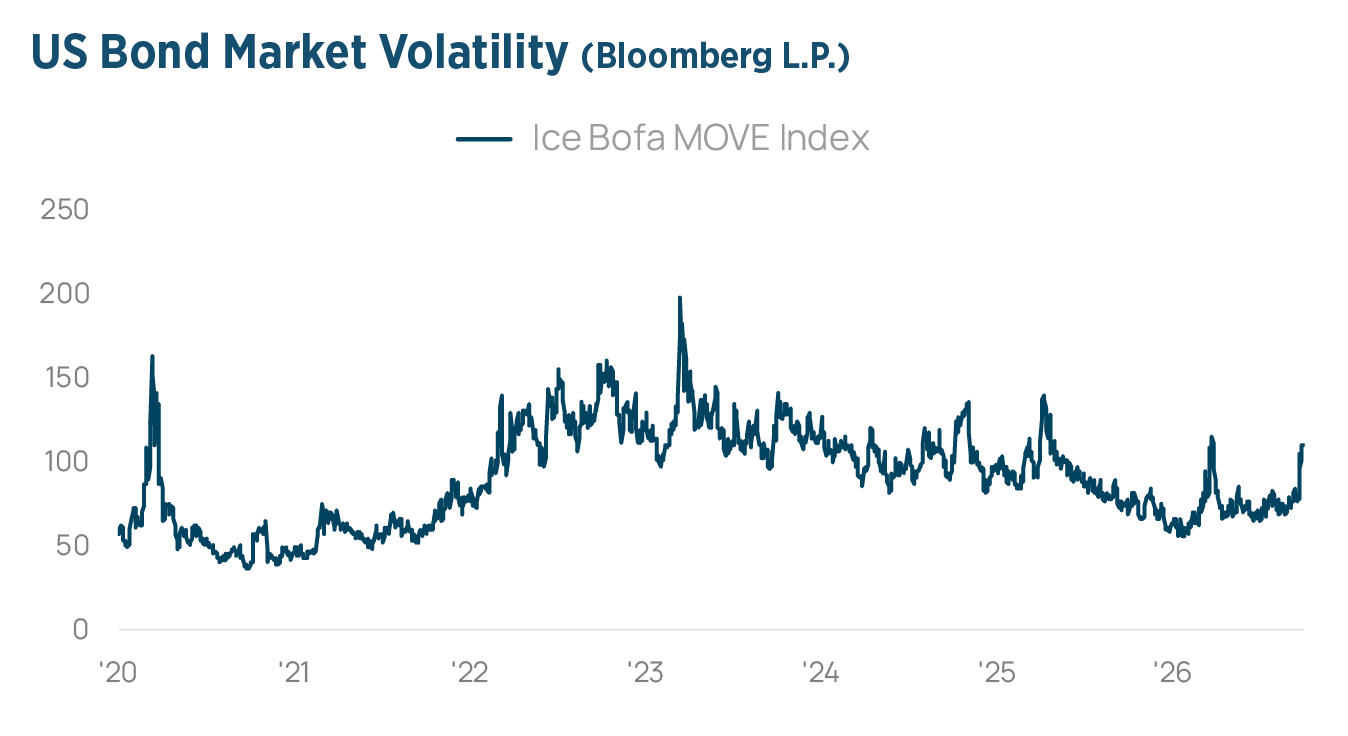
One of the five task forces put in place by the FED Chair Warsh is to review the central bank’s $6.7trillion balance sheet. We don’t expect any big announcement soon; the task force is expected to report by year-end, and any decision rests with the full FED. We can envision the task force coming with different, incremental steps. Ultimately, the balance sheet debate will be about how much liquidity banks need, and how reserves are supplied. Rapid balance-sheet shrinking risks market instability. Liquidity is the dominant driver. We are in a highly financialized world. Treasuries are needed as collateral. Rising yields reduce the available collateral pool, informing us about future liquidity. Reports suggest overall global liquidity remains high. However, the sharp rise in bond volatility and a strengthening US Dollar suggest weakening liquidity conditions, warning of an impending defensive cross-asset positioning, with it, greater demand for collateral.
At current levels, bonds offer attractive carry. Overall, we remain neutral on fixed income, after having upgraded from underweight in Q3. We stay overweight investment grade and underweight high yield, where spreads have begun to respond to higher rates. Private credit remains a source of uncertainty.
S&P500 & VOLATILITY
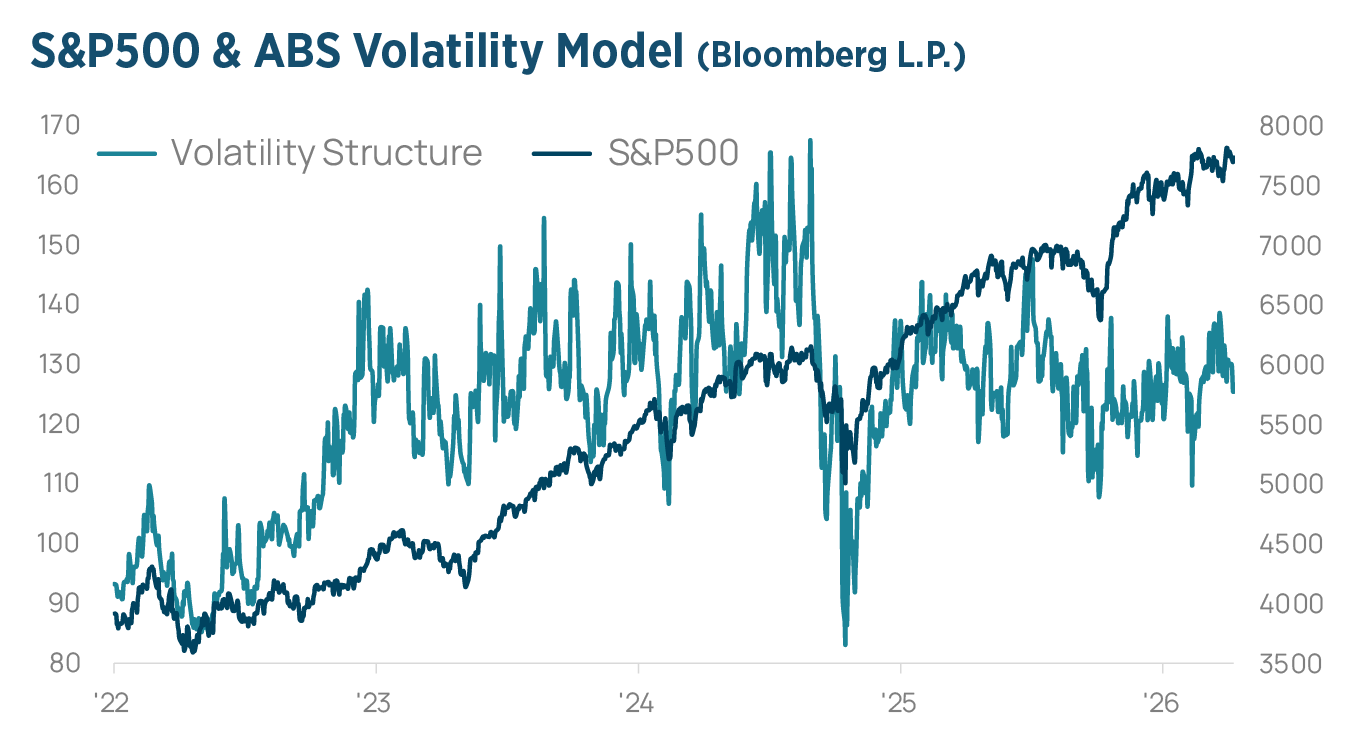
The current investment upswing has now lasted 48 months, dating back to the October 2022 liquidity-cycle low. Earnings, not multiples, have carried it: the forward price-earnings ratio has fallen to 20.1 from 22.0 at the start of the year, while earnings growth is expected at 40% for 2026 and 34% for the third quarter. The equity risk premium has fallen deeper into negative territory.
The VIX closed the quarter at 16.3, close to its 2026 lows, even as US bond yields reached a two-decade high and rates volatility spiked to near a one-year high.
Positioning reflects this calm. Demand for protection remains subdued, about 50% of the of the top 100 stocks show an inverted call skew, a sign of extreme bullishness. With the mid-term elections ahead, during a historically choppier period, we see an asymmetry in being long equity volatility.
We therefore move equities to underweight, while we remain overweight US equities. We favor AI infrastructure and equipment suppliers, where demand visibility is strongest.